


 DownLoad:


HTML
-
The Yellow River, an essential water supply source in North China (Xu [1]), is the second longest river in China. The Yellow River Basin, spanning 795,000 km2, connects the Qinghai-Tibet Plateau, the Loess Plateau and the North China Plain. With over 12% of the national cultivated land area and water consumption, this region plays a vital role in ensuring food and water security (Jing et al. [2]; Li et al. [3]). However, as most of the Yellow River Basin is located in arid and semi-arid regions (Huang et al. [4]), its total water resources are limited and unevenly distributed over time and space. Consequently, the per capita water resource availability in the basin is significantly lower than the global average (Chen et al. [5]).
With global warming, the temperature in the Yellow River Basin is rising rapidly (Fu et al. [6]), and the local water cycle processes are being affected (Yin et al. [7]; Zhao et al. [8]; Ziegler et al. [9]). Over the past 30 years, the Yellow River has been witnessing a trend of drying up due to decreased precipitation and increased evaporation (Yang et al. [10]; Zhou and Huang [11]). Meanwhile, human activities have exacerbated water scarcity in the region (Li et al. [12]; Wang et al. [13]). These factors not only limit agricultural production and damage the ecological environment but also hinder the sustainable development of the social economy (Chen et al. [14]; Xu et al. [15]). Therefore, it is of great practical importance to rationally assess the water resource status of the Yellow River Basin.
In the hydrological cycle, terrestrial water storage (TWS) is a sensitive variable that refers to the cumulative volume of a series of continental water stored in the ground, canopy, glaciers, rivers, lakes, and soil (Xie et al. [16]; Xu et al. [17]). Serving as a comprehensive indicator of regional water content, it plays an important role in assessing the health of local ecosystems and determining the availability of water resources (Wang et al. [18]). At the same time, it is intrinsically linked to drought events and terrestrial carbon deposition (Pokhrel et al. [19]; Humphrey et al. [20]). The Gravity Recovery and Climate Experiment (GRACE) program provides data support for the accurate assessment of global and regional TWS. For example, Xu et al. [21] found a decrease in TWS in the southeastern Tibetan Plateau, northern and northwestern China, and an increase in TWS in northeastern, western, and southern China based on GRACE data. An et al. [22] used GRACE data in conjunction with the water balance equation to attribute the decrease in TWS in the drylands of northern China. As a typical climate change sensitive region, the TWS changes in the Yellow River Basin have received extensive attention from experts over the past decade. GRACE data suggest that TWS in the Yellow River Basin shows a declining trend, with its spatial distribution characterized by a slow increase in the source area and a rapid decrease in the non-source areas (Meng et al. [23]; Lv et al. [24]). In addition, the spatial weighted centroid analysis method has revealed an increasing disparity in TWS between the upstream and downstream regions of the Yellow River Basin (Jing et al. [2]). The significant decrease in TWS implies a disruption in the region's water balance, where the output water (e.g., evapotranspiration, runoff, and human water use) exceeds the input water (e.g., precipitation), thereby exacerbating local water stress.
It has been shown that the change of TWS in the Yellow River Basin is influenced by both human activities and climate change. In terms of human activities, the increase in urbanization rate and total population has led to an increase in industrial and domestic water usage. Additionally, due to the basin's extensive agricultural croplands, irrigation is the primary anthropogenic factor causing groundwater reduction (Li et al. [25]; Lin et al. [26]; Zhang et al. [27]). Lv et al. [24] found that irrigation activities and the Grain for Green project have increased evapotranspiration, consequently contributing to a decrease in terrestrial water storage change. Moreover, reservoir operations significantly impact localized TWS changes (Dong et al. [28]; Liu et al. [29]; Xie et al. [30]). In terms of climate change, the TWS are impacted by precipitation, evaporation and runoff according to the surface water balance equation. Zhang et al. [31] found that the decrease in precipitation is an important factor contributing to the reduction in TWS, and decreasing runoff also plays an important role in water scarcity (Xu [1]; Wang et al. [32]).
Previous studies have primarily focused on the effects of various factors on the annual changes of TWS. Given that precipitation, evaporation, and runoff exhibit seasonal cycles (Ji et al. [33]; Wu et al. [34]; Zhang et al. [31]), and since irrigation water use predominantly occurs from May to August (Wang et al. [35]), these factors might have seasonally varying impacts on TWS changes. Moreover, with the presence of both solid and liquid forms of precipitation during the cold season, it is not clear whether the change of precipitation phase indirectly affects the TWS in the Yellow River Basin. The change of the Melting Level Height (MLH) plays a crucial role in this change of precipitation phase state, which represents the zero-degree wet bulb temperature at the surface. This parameter is important for cloud processes and precipitation phasing because ice particles start to melt at this height (Dessens et al. [36]; Wang et al. [35]). According to Prein and Heymsfield [37], the global terrestrial MLH has increased at a rate of 32 m dec–1 with global warming. This rising MLH leads to a change in the precipitation phase (more snowfall to rainfall) and affects the hydrological cycle. Therefore, it is necessary to explore the impacts of climate change and human activities on cold-season TWS, and the impacts of MLH changes on hydrological processes. Section 2 introduces the datasets and study area. In section 3, we discuss the changes in TWS and the factors influencing them, including the effects of climate change on cold-season TWS and the impact of human activities on water resources. The conclusion and discussion are given in section 4.
-
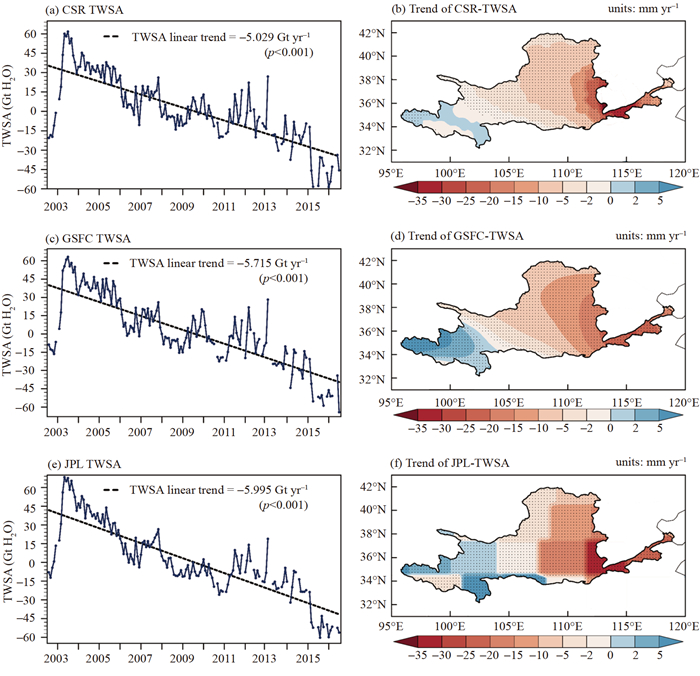
The terrestrial water storage anomaly (TWSA) data in this study were obtained from the GRACE mission. This mission consists of a binary satellite system and was launched by the American National Aeronautics and Space Administration (NASA) and the German Aerospace Center (Frappart and Ramillien [38]; Tapley et al. [39]). Hydrological information, including high-accuracy maps of Earth's time-variable gravity field, is produced by measuring the change in distance between satellites (Jacob et al. [40]; Syed et al. [41]; Tapley et al. [42]). Mass concentration blocks (mascons), estimating gravitational fields with priori constraints in space and time, are the latest schemes with fewer measurement errors (Wang et al. [35]; Watkins et al. [43]). We selected data from the Center for Space Research (CSR) of the University of Texas RL06 Mascon Solutions (version 02), the Jet Propulsion Laboratory (JPL-M) and the Goddard Space Flight Center (GSFC-M). The monthly TWSA data were available from January 2003 to December 2016, and the spatial resolution was uniformly interpolated to 0.25°. Because these datasets exhibit similar trends (Fig. 1), we used the ensemble mean as the TWS for the Yellow River Basin.

Figure 1. The time series of the monthly TWS anomalies during 2003–2016 from (a) CSR, (c) GSFC, and (e) JPL datasets. The trend distribution of the TWSA from (b) CSR, (d) GSFC, and (f) JPL datasets. The dotted areas represent regions with a confidence level exceeding 95%.
-
The fifth-generation reanalysis global atmosphere (ERA5), produced by the European Centre for Medium-Range Weather Forecasts (ECMWF), has replaced the ERA-Interim reanalysis because of its improved resolution and the availability of more output parameters such as hourly output throughout (Hersbach et al. [44]). This reanalysis product combines vast amounts of historical observational data with advanced numerical weather models (Bell et al. [45]). It provides a wide range of spatially and temporally resolved meteorological parameters, such as precipitation, temperature, humidity, and pressure at various levels. The inputs to ERA5 come from various sources, including weather stations, satellites, radar, and ocean buoys. It is worth noting that errors may occur during the data assimilation process (Shen et al. [46]). In previous research, ERA5 has been used to examine climate change in the Yellow River Basin (Pang et al. [47]; Tian et al. [48]).
Based on the water balance model, the variation in TWS (terrestrial water storage changes, TWSC) equals the precipitation minus evaporation and runoff (Rodell et al. [49]). Because precipitation includes rainfall and snowfall, the equation can be written as follows:
$$ {\rm{TWSC}} = {\rm{Rainfall}} + {\rm{Snowfall}} - E - R + {{\rm{Res}}} $$ (1) where E represents evaporation, R represents runoff, and Res represents the residual term, including irrigation and other water management transfers.
The monthly 2 m temperature, snowfall, total precipitation, runoff and evaporation from the ERA5 reanalysis dataset are used to analyze changes in climate factors during 1979–2021. The spatial resolution of the data is 0.25°, and the rainfall in the study is derived from total precipitation minus snowfall.
-
The MLH is defined as the zero-degree wet bulb temperature above the surface (Prein and Heymsfield [37]), and its variation has an effect on the precipitation phase change. Since it is challenging to obtain MLH data directly, this study uses the method proposed by Wang et al. [35] to calculate the MLH by interpolation using 137 model levels in the vertical direction of ERA5 (Please refer to the Appendix for more details). The wet-bulb temperature (Tw) is calculated from air temperature and specific humidity (Prein and Heymsfield [37]; Knox et al. [50]), which are obtained from hourly reanalysis output for ERA5 model levels.
-
Population density data was obtained from WorldPop (
https://www.worldpop.org/ ), which provides data in units of people per square kilometer. We selected the data from 2003 to 2014 and calculated the average population density in the Yellow River Basin during this period. -
To investigate human water use in the Yellow River Basin, we utilized data from WaterGAP v2.2d. WaterGAP is a global hydrological model that quantifies water abstraction and use by different sectors of humanity (Schmied et al. [51]). Previous studies have indicated that the latest version of the WaterGAP 2.2d model exhibits reasonable performance in simulating key variables such as TWS and human water abstraction (Müller et al. [51]). Therefore, it is used for studying water storage and human water usage (An et al. [52]; Li et al. [53]). We selected data on potential water withdrawals and potential consumptive water use for four sectors: irrigation, industrial, domestic, and livestock, spanning from 2003 to 2016. There are two simulation scenarios in the model: "histoc", which considers both human activities and natural factors, and "nosoc", which considers only natural factors. We calculated the evapotranspiration attributed to human activities by taking the difference between the evapotranspiration data from the standard model and the natural model.
-
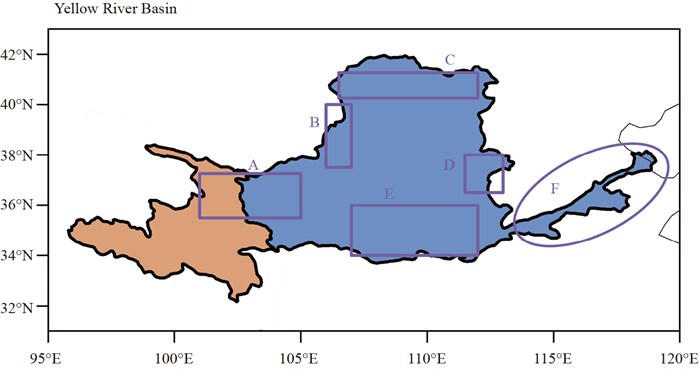
The Yellow River Basin spans an area of 795,000 km2, linking the Qinghai-Tibet Plateau, the Loess Plateau, and the North China Plain. Since the Yellow River Basin covers multiple geographical units, it is divided into source and non-source regions (Fig. 2). The source area is defined as the region where the Yellow River Basin and the Tibetan Plateau overlap, while the rest of the region is a non-source area. Additionally, we have selected six sub-regions based on the distribution of the major irrigation districts within the Yellow River Basin (Peng et al. [54]), as indicated in Table 1.

Figure 2. The Yellow River Basin. Orange area is the source area, blue area is the non-source area, and the purple solid line encircles the major irrigation districts within the Yellow River Basin.
District Location Population density (units: people km–2) A 35.5°N–37.25°N, 101°E–105°E 161 B 37.5°N–40°N, 106°E–107°E 218 C 40.25°N–41.25°N, 106.5°E–112°E 145 D 36.5°N–38°N, 111.5°E–113°E 541 E 34°N–36°N, 107°E–112°E 364 F Downstream of the Yellow River Basin 697 Table 1. Location of the major irrigation districts.
-
To reduce uncertainty in our analysis, we compared the precipitation in the ERA5 data with the monthly precipitation data from the GPCC Full Data Monthly Version 2022, published by the Global Precipitation Climatology Centre (GPCC). GPCC data is an observation-based global precipitation dataset, which contains precipitation information from more than 85,000 observation stations worldwide (Schneider et al. [55, 56]) and is known for its high accuracy. It has played an important role in studying precipitation changes in the Yellow River Basin (Wang and Wang [57]; Huang et al. [58]). Additionally, we compared the precipitation, snowfall, evapotranspiration, and runoff data from ERA5 with the Japan Meteorological Agency's JRA-55 reanalysis dataset. The JRA-55 dataset is suitable for studying climate factor changes in the Yellow River Basin (Miao and Wang [59]).
According to Table 2, the correlation coefficients of precipitation between ERA5 and GPCC/JRA-55 reached 0.977. Additionally, the correlation coefficients of rainfall, snowfall, evapotranspiration, and runoff between ERA5 and JRA-55 were 0.980, 0.819, 0.985, and 0.864, respectively. All these values passed the significance test. Therefore, ERA5 data can be used to study the changing characteristics of climate factors in the Yellow River Basin.
Correlation coefficient GPCC precipitation JRA-55 precipitation JRA-55 rainfall JRA-55 snowfall JRA-55 evaporation JRA-55 runoff ERA5 0.977*** 0.977*** 0.980*** 0.819*** 0.985*** 0.864*** ***Statistically significant at the confidence level of 99% Table 2. Correlation coefficients between ERA5 data and GPCC and JRA-55 data in the Yellow River Basin.
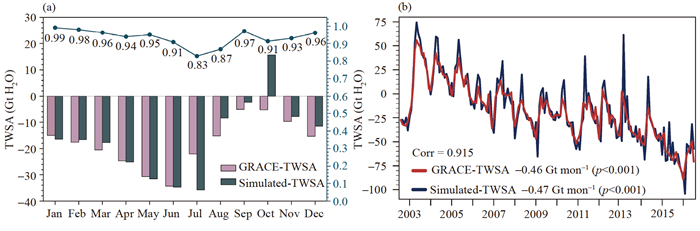
Before using ERA5 data to analyze the effects of each climatic factor on TWS, it is necessary to demonstrate that the GRACE dataset is consistent with the TWSA derived from the ERA5 reanalysis data (Lei et al. [60]; Velicogna et al. [61]). According to the correlation analysis (Fig. 3), the correlation coefficients between observed and simulated values were greater than 0.9 for all months except for July and August, where they still reached substantial levels of 0.83 and 0.87, respectively. Furthermore, a high correlation was observed in the TWSA time series (0.915), and the yearly trends were similar (–0.46 Gt mon–1 for GRACE-TWSA and –0.47 Gt mon–1 for the simulated TWSA).

Figure 3. (a) Monthly mean GRACE-observed TWSA and ERA5-simulated TWSA in the Yellow River Basin. Temporal correlations between the observed TWSA and estimated TWSA are depicted as solid lines. (b) GRACE-observed TWSA compared with the ERA5-estimated TWSA in the Yellow River Basin during 2003–2016.
2.1. Datasets
2.1.1. SATELLITE DATASET
2.1.2. REANALYSIS DATASETS
2.1.3. MELTING LEVEL HEIGHT
2.1.4. POPULATION DENSITY
2.2. Hydrological model
2.3. Study area
2.4. ERA5 data applicability analysis
-
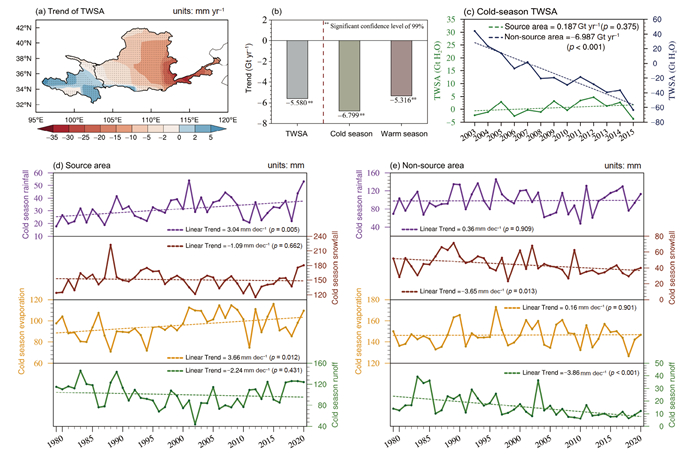
The TWSA in the Yellow River Basin showed an overall declining trend at a rate of –5.580 Gt yr–1, which was consistent with prior research (Lv et al. [24]; Li et al. [62]). However, in terms of spatial distribution, an opposite trend of TWSA occurred, with a slight increase in the source area and a notable decrease in the non-source area (Fig. 4a). Comparing the time series of TWSA between the cold season (October to April of the following year) and the warm season (May to September), it became evident that the TWSA in the cold season decreased at a rate of –6.799 Gt yr–1 (Fig. 4b). This decline was more significant than that observed during the warm season (–5.316 Gt yr–1) and over the entire year.

Figure 4. (a) The trend distribution of the TWSA during 2003–2016. The dotted areas represent regions that pass the 0.05 significance level of Student's t-test. (b) Trends in TWSA for the entire year, cold season, and warm season. (c) Time series of TWSA during the cold season in the source area (green) and non-source area (blue) of the Yellow River Basin. (d) Time series of rainfall, snowfall, evaporation, and runoff in the source area from 1979 to 2020. (e) The same as Fig. 4d, but for the non-source area.
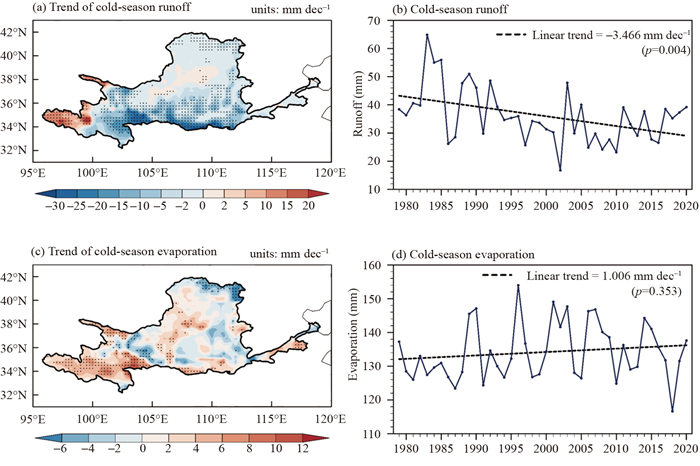
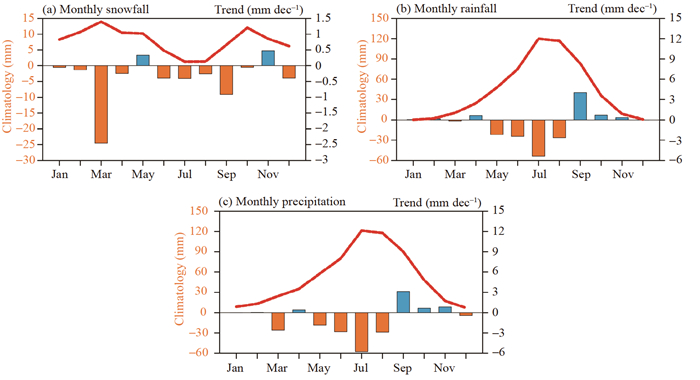
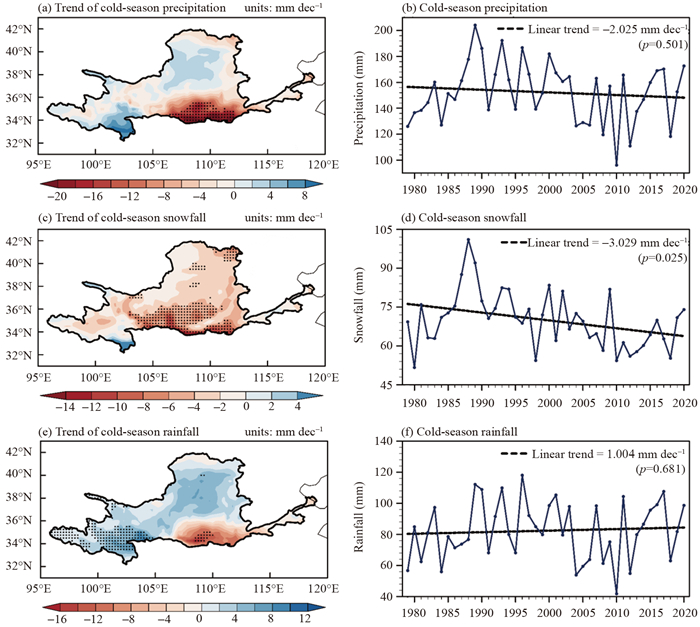
In the cold season, the TWS was replenished by precipitation, while runoff and evaporation were discharge processes (Xu [1]; Wang et al. [35]). From 1979 to 2020, the evaporation in the Yellow River Basin increased during the cold season (1.01 mm dec–1), while runoff significantly decreased at a rate of –3.47 mm dec–1 (Fig. 5). The latter might be caused by a decrease in precipitation and an increase in evaporation and irrigation, as indicated by previous studies (Yang et al. [10]; Chen et al. [63]). As a primary source of replenishment, the decline in precipitation in the Yellow River Basin (–2.03 mm dec–1) was one of the reasons for the reduction in cold-season TWS. Due to the presence of both snowfall and rainfall during the cold season (Fig. 6), we separately analyzed their trends. As temperatures continued to rise, the general trends in snowfall and rainfall within the Yellow River Basin differed. From 1979 to 2020, snowfall during the cold season decreased at a rate of –3.03 mm dec–1, while rainfall exhibited a slight increase (Fig. 7).

Figure 5. Trend of (a) runoff and (c) evaporation in the cold season during the period of 1979–2020. The dotted areas are those with a confidence level exceeding 95%. Time series of (b) runoff and (d) evaporation in the cold season during the period of 1979–2020.

Figure 6. Monthly climatology (red lines) and trends (bars) of annual (a) snowfall, (b) rainfall, and (c) total precipitation in the Yellow River Basin during the period of 1979–2021.

Figure 7. Spatial distribution of trends of (a) precipitation, (c) snowfall, and (e) rainfall in the cold season during the period of 1979–2020. The dotted areas are those with a confidence level exceeding 95%. Time series of (b) total precipitation, (d) snowfall, and (f) rainfall during the cold season in the Yellow River Basin.
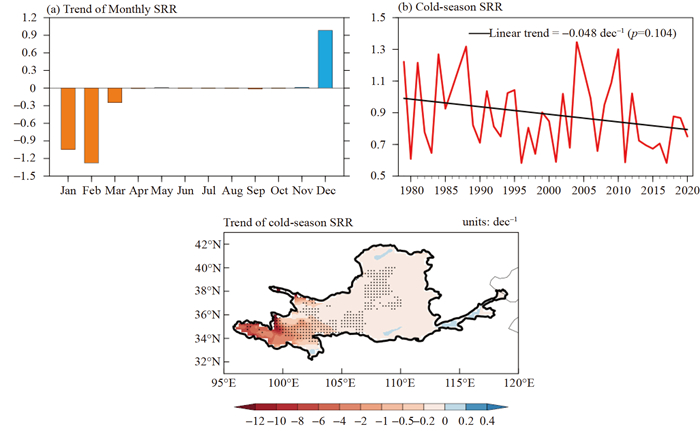
To better understand their relationship, the snowfall-to-rainfall ratio (SRR, the calculation formula is in the supplement) was explored. This ratio has gained growing scientific interest recently, as it has the potential to impact surface albedo changes and the timing of spring runoff (Berghuijs et al. [64]; Liu et al. [65]; Screen et al. [66]; Wang et al. [67]). The higher the SRR, the larger the proportion of snowfall compared to rainfall. The SRR during the cold season decreased at a rate of –0.048 dec–1 (Fig. 8). This trend was observed across most of the basin's areas, especially near the source region.

Figure 8. (a) Monthly trends of the averaged SRR in the Yellow River Basin during the period of 1979–2020. (b) Time series of the average SRR in the cold season. (c) Spatial distribution of SRR trends during the cold season; dotted areas are those with a confidence level exceeding 95%.
Since the Yellow River Basin spans several geomorphic units, the trend of the TWSA and its influencing factors vary in spatial distribution. Therefore, the Yellow River Basin is divided into source and non-source parts. According to Fig. 4c, the TWSA in the non-source area of the Yellow River decreased rapidly at a rate of –6.987 Gt yr–1, while in the source area, there was a slight increase. In both the source area and non-source area, runoff was rapidly declining and exhibited the highest partial correlation coefficients with TWSA (Table 3). At the same time, snowfall decreased in both subregions while rainfall increased. In the source area, rainfall was rapidly increasing at a rate of 3.04 mm dec–1, while snowfall was decreasing at a rate of –1.09 mm dec–1. In the non-source area, rainfall was increasing slowly, while snowfall was rapidly decreasing at a rate of –3.65 mm dec–1. Snowfall and rainfall had different mechanisms for replenishing TWS. Snowfall directly replenished TWS in solid form until it melted, thereby slowing down the decline of TWS during this period. In contrast, rainfall was rapidly lost through runoff and evaporation, in addition to infiltrating underground or remaining on the surface (Wang et al. [35]). Therefore, the rising rainfall and declining snowfall exacerbated the scarcity of water resources.
Region Time Snowfall Rainfall Runoff Evaporation Source area 2003–2015 –0.46 0.36 0.74** –0.48 2003–2008 0.26 0.44 0.86 –0.29 2009–2015 –0.52 0.60 0.46 0.67 Non-source area 2003–2015 0.47 –0.74** 0.90*** 0.43 2003–2008 0.84 0.25 0.923 –0.56 2009–2015 0.86 –0.88 0.94* 0.44 ***Statistically significant at the confidence level of 99% **Statistically significant at the confidence level of 95% *Statistically significant at the confidence level of 90% Table 3. Partial correlation coefficients between snowfall, rainfall, runoff, evapotranspiration and TWSA in the source and non-source areas of the Yellow River during the cold season.
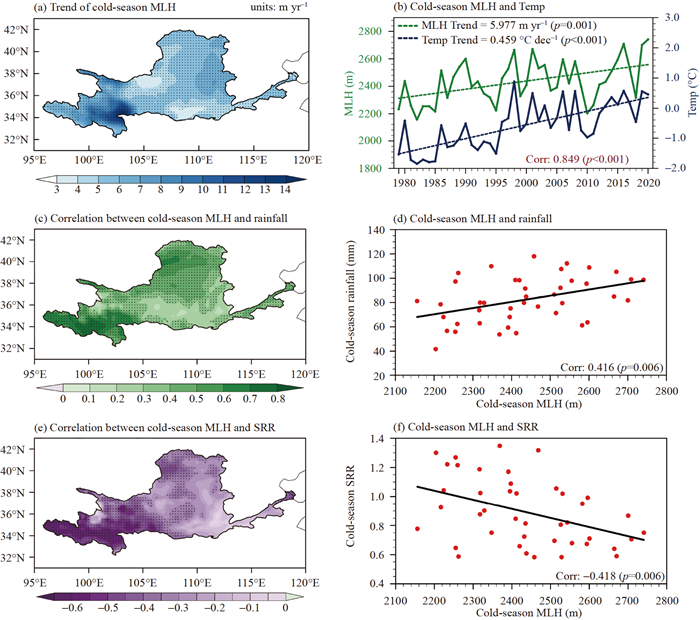
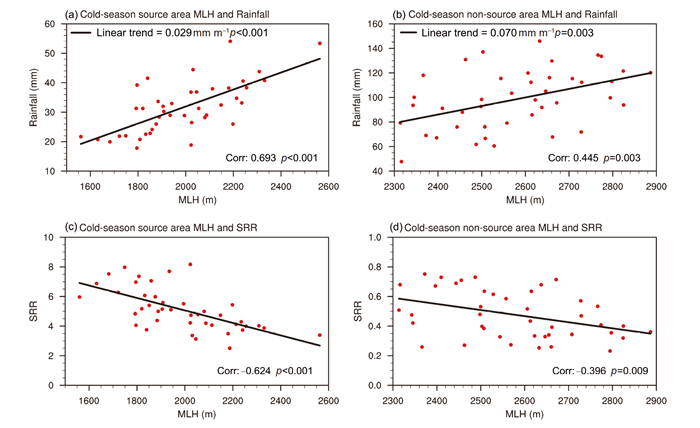
To investigate their temporal impact on TWS, the study period was divided into two parts: 2003–2008 and 2009–2015. In source areas and non-source areas, the partial correlation coefficient of rainfall with TWSA increased over time, indicating that the effect of rainfall became more significant, which may be associated with an increase in MLH. According to Fig. 9, the MLH increased during the cold season, especially in the source area. The average MLH in the Yellow River Basin increased at a rate of 5.977 m yr–1 and exhibited a strong positive correlation (correlation coefficient of 0.849) with the rising near-surface temperature. This suggests that the MLH in the Yellow River Basin was primarily driven by warming. Prein and Heymsfield [37] found that, with global warming, the increase in MLH resulted in decreasing snow and increasing rain events. In our study, the MLH was positively correlated with rainfall and negatively correlated with SRR. In the non-source area, a one-meter increase in MLH corresponded to a 0.07 mm increase in rainfall (Fig. 10). This indicates that during the cold season, more precipitation in the Yellow River Basin experienced a phase change from snowfall to rainfall.

Figure 9. (a) The trend of the cold-season MLH during 1979–2020. The dotted areas indicate those with a confidence level exceeding 95%. (b) The time series of cold-season MLH and temperature. (c) Correlation map between the MLH and rainfall in the cold season. (d) The scatter distribution and correlation between MLH and rainfall. (e) Correlation map between the MLH and SRR in the cold season. (f) The scatter distribution and correlation between MLH and SRR.

Figure 10. The scatter distribution and correlation between MLH and rainfall in the (a) source area and (b) non-source area. The scatter distribution and correlation between MLH and SRR in the (a) source area and (d) non-source area.
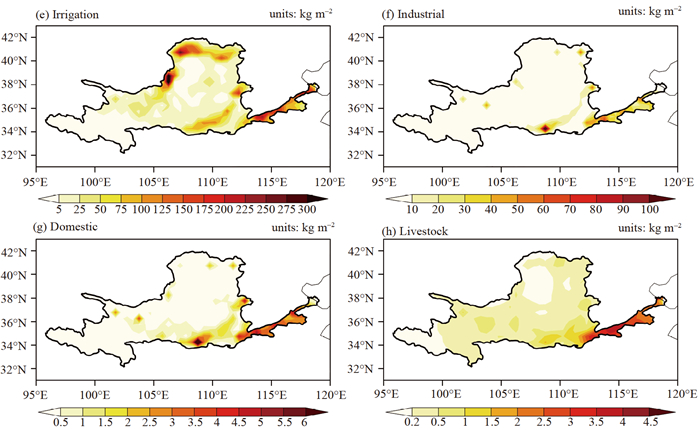
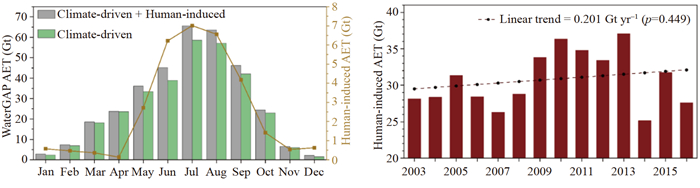
Due to the large population in the Yellow River Basin, human activities have a notable impact on its water resources (Miao et al. [68]; Wang et al. [69]). WaterGAP 2.2d categorizes human water usage into four sectors: irrigation, domestic, industrial, and livestock. By comparing the potential water withdrawal and potential consumptive water use across various sectors of human activity, we observed similar spatial distribution (Fig. 11–12). Irrigation water use was primarily concentrated in various irrigation zones within the Yellow River Basin, and household water use followed a distribution similar to population density. The water withdrawals and consumption of each sector were increasing (Table 4), which resulted in elevated regional evapotranspiration (Fig. 13) and, consequently, a higher outflow of regional water resources. However, when considering monthly total water withdrawals and consumption, we found that human water usage was primarily concentrated during the warm season, particularly from June to August. As a result, the impact of human activities on cold-season water resources was relatively limited.

Figure 11. Average consumptive water use for (a) irrigation, (b) industrial, (c) domestic, and (d) livestock in the Yellow River Basin from 2003 to 2016.

Figure 12. Average water withdrawal for (a) irrigation, (b) industrial, (c) domestic, and (d) livestock in the Yellow River Basin from 2003 to 2016.
Human activities Trend (Gt dec–1) Potential irrigation consumptive water use 1.442 Potential irrigation water withdrawals 2.897 Potential industrial consumptive water use 1.916* Potential industrial water withdrawals 5.096* Potential domestic consumptive water use 0.026* Potential domestic water withdrawals 0.253* Potential livestock consumptive water use 0.050* *Statistically significant at the confidence level of 99% Table 4. Potential water withdrawal and usage by each sector.

Figure 13. (a) The monthly average actual evapotranspiration (AET) in the Yellow River Basin in both the standard mode and the natural mode. Solid lines represent AET generated by human activities. (b) The time series of human-induced AET.
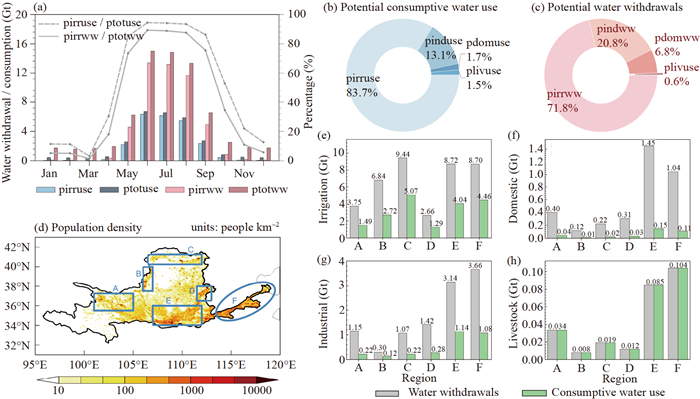
Among all water sectors, irrigation occupied the largest proportion in potential water withdrawals and potential consumptive water use (Fig. 14), accounting for 71.8% and 83.7%, respectively, followed by industrial water use (20.8% and 13.1%, respectively). Six subregions were chosen based on the distribution of irrigation areas within the Yellow River Basin. Except for Region C, where the Inner Mongolia Yellow River Irrigation Area was located, the population density in the remaining subregions was higher than that in the Yellow River Basin (Table 1). Among all the subregions, Region C had the highest irrigation water withdrawals and consumptive water use (9.44 Gt and 5.07 Gt), followed by Regions F and E. Regions E and F, situated in the middle and lower reaches of the Yellow River Basin, demonstrated high water usage across various sectors.

Figure 14. (a) The potential consumptive irrigation water use (pirruse), total consumptive water use (ptotuse), irrigation withdrawals (pirrww), total withdrawals (ptotww), and the percentage of consumptive irrigation water use and irrigation withdrawals for each month. The proportion of different sectors in (b) potential consumptive water use and (c) potential water withdrawal. Water withdrawal and water consumption for (d) irrigation, (e) industrial, (g) domestic, and (h) livestock in various sub-regions. (f) Average population density in the Yellow River Basin from 1979 to 2021. (pdomuse: potential domestic consumptive water use; pdomww: potential domestic water withdrawals; pinduse: potential industrial consumptive water use; pindww: potential industrial water withdrawals; pirruse: potential irrigation consumptive water use; pirrww: potential irrigation water withdrawals; plivuse: potential livestock consumptive water use)
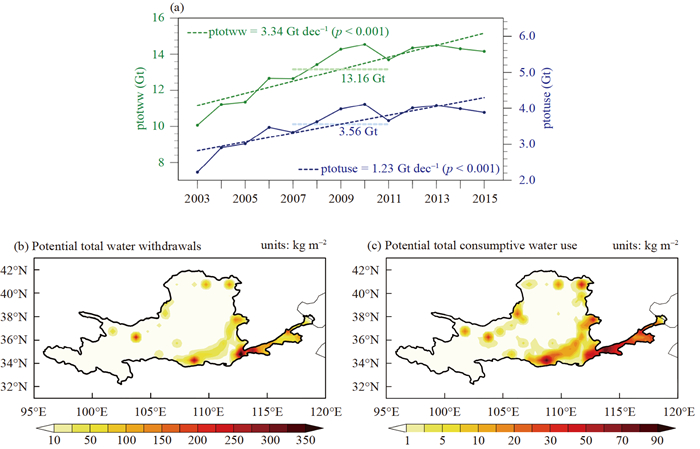
However, during the cold season, the spatial distribution of human water use in the Yellow River Basin notably diverges from the annual pattern (Figs. 15b and 15c). The distribution of total water use is more similar to that of industrial water use and is mainly concentrated in the middle and lower reaches of the Yellow River Basin, as well as in densely populated cities of the upper reaches, such as Lanzhou, Xining, Yinchuan, and Hohhot. This distribution reflects the dominance of industrial water use during the cold season, where industrial water withdrawal and consumptive use account for over 60% of the total. Although human water use in the cold season is lower compared to the warm season, with average total withdrawal and consumptive use of 13.16 Gt and 3.56 Gt, respectively, it's important to note that water usage in the cold season is also on an increasing trend (Fig. 15a).

Figure 15. (a) Time series of total water withdrawals and water consumption during the cold season, with green (blue) values representing the average withdrawals (water consumption) during the cold season during 2003–2015; spatial distribution of (b) total water withdrawals and (c) total water consumption during the cold season.
-
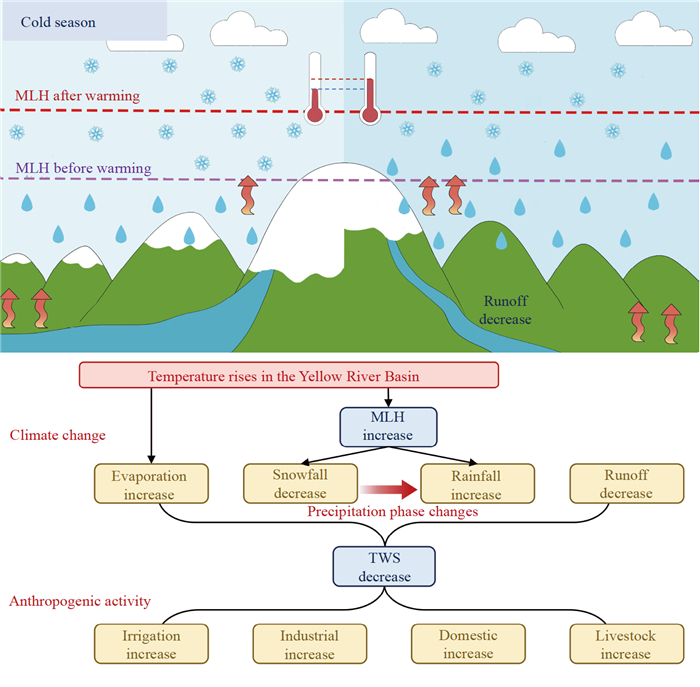
TWS is the sum of continental water, and its change plays an essential role in investigating the sustainability of water resources. For the entire Yellow River Basin, the decline in TWSA during the cold season can be attributed to reduced precipitation (–2.03 mm dec–1) and runoff (–3.47 mm dec–1), along with an increase in evaporation (1.01 mm dec–1). Furthermore, due to rising temperatures, the MLH increased significantly at a rate of 5.98 m yr–1. This change has led to more precipitation to transition from snowfall to rainfall patterns. Snowfall directly replenishes TWS in its solid state until it melts during the warm season, whereas rainfall can quickly dissipate through runoff, evaporation, or other methods. Consequently, the increase in MLH exacerbates water resource scarcity and stress (Fig. 16). This phenomenon is also observed in the non-source areas of the Yellow River Basin.

Figure 16. Schematic illustration of the study. Increased runoff, rising MLH, and intensified human activity collectively contributed to the reduction of TWS.
However, in the source areas of the Yellow River Basin, the increase in TWS is also influenced by additional mechanisms. Because of global warming, glaciers on the Tibetan Plateau are melting, causing a rise in lake levels (Rodell et al. [49]; Long et al. [70]; Zhang et al. [71]). The TWS was complemented by the expansion of lakes in the Yellow River's source area. Moreover, since the source area is situated in the transition zone between perennial permafrost and seasonal permafrost, the degradation of permafrost resulting from warming also played an important role in the rising TWS (Meng et al. [23]; Qin et al. [72]).
Additionally, due to the large population and extensive agricultural land in the Yellow River Basin, human activities such as agricultural irrigation, industrial production, and reservoir construction also had a significant impact on TWS (Dong et al. [28]; Jiang et al. [73]; Lv et al. [74]). In this study, human activities were categorized into four sectors: irrigation, industry, household, and livestock. The annual water consumption in each sector was increasing, which exacerbated the issue of water scarcity. However, because irrigation water withdrawal and consumptive water use constituted 71.8% and 83.7% of the total, and irrigation primarily occurred during the warm season, human activities had a limited impact on cold-season water resources.
-
The melting layer height refers to the height of the zero-degree wet bulb temperature, calculated using the method of Wang et al. [35]. The wet bulb temperature can be derived as (Ding et al. [75]):
$$ {{{\left( {{T_w}} \right)}_k} = {{\rm{T}}_k} - \frac{{\left( {1 - {\rm{R}}{{\rm{H}}_K}} \right) \times {e_{{\rm{sat}}}}\left( {{T_k}} \right)}}{{0.000643 \times {P_K} + \frac{{\partial {e_{{\rm{sat}}}}\left( {{T_k}} \right)}}{{\partial {T_k}}}}}} $$ (1) $$ {{e_{{\rm{sat}}}}\left( {{T_k}} \right) = 6.1078 \times {e^{\left( {\frac{{17.27 \times {T_k}}}{{{T_k} + 273.3}}} \right)}}} $$ (2) where ${\left({{T_w}} \right)_k}$ is the wet bulb temperature, ${{{T}}_k}$ represents temperature, and ${\rm{R}}{{\rm{H}}_K}$ is relative humidity. ${e_{{\rm{sat}}}}\left({{T_k}} \right)$ is the saturated vapor pressure at ${{{T}}_k}$ (Murray [76]). The "k" represents the k-layer atmosphere. The full level pressure (k level) is the average of the pressures of two half-layer atmospheres (Pk = (Pk+1/2 + Pk–1/2)/2), and the half-layer pressure is defined as:
$$ {{P_{K + 1/2}} = {a_{k + 1/2}} + {b_{k + 1/2}} \cdot {\rm{sp}}} $$ (3) where sp is the surface pressure. ${a_{k + 1/2}}$ and ${b_{k + 1/2}}$ are coefficients obtained from the ECMWF website. The geopotential height is calculated as (Wang et al. [35]):
$$ {{\phi _{k + 1/2}} = {\phi _s} + \sum\nolimits_{j = k + 1}^{137}{R_d} \times {{({T_v})}_j} \times {\rm{ln}}\left( {\frac{{{P_{j + 1/2}}}}{{{P_{j - 1/2}}}}} \right)} $$ (4) where ${\phi _s}$ represents the geopotential height at the Earth's surface, Tv is the virtual temperature and Rd represents the gas constant for dry air.
Coefficients in Eq. 3 and half-level pressure are obtained from the ECMWF website (
https://www.ecmwf.int/en/forecasts/documentation-and-support/137-model-levels ). -
$$ {{\rm{SRR}} = \frac{{{\rm{Snowfall}}}}{{{\rm{Rainfall}}}} \times 100\% } $$

 粤公网安备 4401069904700002号