HTML
-
Haze, a slight obscuration of the lower atmosphere with atmospheric visibility < 10 km, is caused by a combination of particular atmospheric conditions and the entrapment of suspended dust, smoke and industrial pollutants [1]. The concentration of atmospheric pollutants in China has increased in recent years with the rapid industrialization and urbanization and thus haze pollution is now a common occurrence [2-4]. A large number of haze events have been reported in the media, with many reports of severe haze events over major cities and entire regions of China in 2013 [5, 6]. As haze events have attracted increasing attention, research on haze pollution in China has also increased rapidly [7, 8], which can be divided into five categories: the identification of haze [9]; the spatial and temporal distribution of haze [10-12]; the climatic characteristics of haze events [13]; analyses of the cause of haze events [14-16]; and numerical simulations [17]. All these studies have concluded that the number of haze days has shown a clear upward trend accompanied by a significant reduction in atmospheric visibility since the 1960s [18]. This increase is generally attributed to the increase in the amount of aerosols in the atmosphere.
The increasing number of haze days has been well documented in China. However, there has been less research on the characteristics of different grades of haze days, which may give a clearer analysis of haze pollution. It is important to show the different patterns in the data collected when air pollution control measures are in effect. In this study, haze days were divided into four grades using visibility data and the variation in probability was analyzed for each grade. The data and methods are described in Section 2, followed by an analysis of the probability of the various grades of haze days in Section 3. Section 4 presents the variations over time of the four grades corresponding to large, medium and small cities and a summary is presented in Section 5.
-
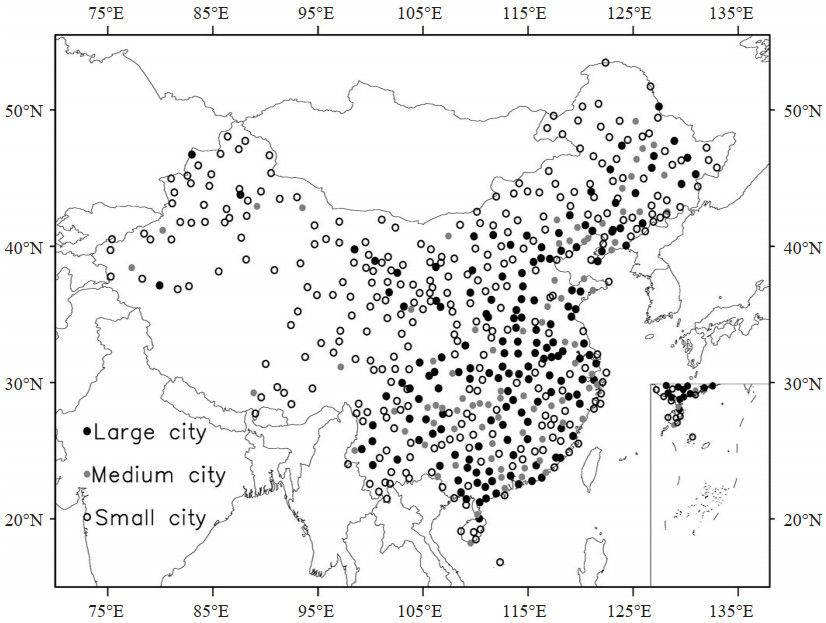
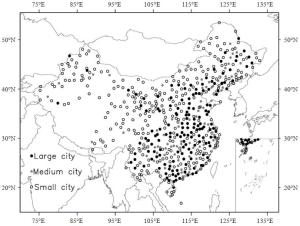
This study used observational data from 756 meteorological stations in China compiled by the National Meteorological Information Center, China Meteorological Administration from 1960 to 2013. The data included the number of haze days and the visibility.The visibility was observed four times each day at 2:00, 8: 00, 14: 00 and 20: 00 h Beijing time. The datasets passed the quality control tests of the National Meteorological Information Center, but we adopted a more stringent standard for site selection to avoid errors caused by a lack of data. Stations with an estimated deficit of > 5% observations in one year were excluded and relocation of these stations was considered. Fig. 1 shows the geographical distribution of the 543 stations selected for use in this study.
-
The probabilities of four different grades of haze days were calculated. First, haze weather recorded in the observational data was selected as a haze day and the haze data from the 543 station were calculated. Second, the daily mean visibility data were calculated using a previously published method [18]. The haze days at the 543 stations were divided into four categories: slight haze (SLH) days (5 km ≤ vis < 10 km); light haze (LIH) days (3 km ≤ vis < 5 km); moderate haze (MOH) days (2 km ≤ vis < 3 km); and severe haze (SEH) days (vis < 2 km) (Table 1) [19].
Grade Visibility range(km) Mean probability across all stations (%) Slight haze days 5 ≤ vis < 10 95.138 Light haze days 3 ≤ vis < 5 4.166 Moderate haze days 2 ≤ vis < 3 0.559 Severe haze days vis < 2 0.137 Table 1. Classification of the four grades of haze days.
To determine whether the probabilities of the four grades of haze days were affected by climate change, the climatic trend coefficient rxt was calculated. This is defined as the correlation coefficient between the time sequence of x elements (years) and the natural number series (1, 2, 3, ..., n):
$$ {r_{\rm xt}} = \frac{{\sum\limits_{i = 1}^n {\left( {{x_i} - \bar x} \right)(i - \bar t)} }}{{\sqrt {\sum\limits_{i = 1}^n {{{\left( {{x_i} - \bar x} \right)}^2}} \sum\limits_{i = 1}^n {{{\left( {i - \bar t} \right)}^2}} } }} $$ (1) where n is the number of years, xi is the element value of year i, x is the mean value of the sample element value and t =(n+1)/2. If rxt is positive (negative), then the elements in n years have an increasing (decreasing) tendency.${r_{\rm xt}}\sqrt {n - 2} /\sqrt {1 - r_{\rm xt}^2} $ accords with a t distribution of freedom (n-2), which can be tested statistically to determine whether it is significant for the climate trend or is only a random variation.
The trend of the changes in the meteorological elements is generally a linear equation:
$$ {x_t} = {a_0} + {a_1}t,t = 1,2, \ldots n\left( {\rm years} \right) $$ (2) $$ \frac{{{\rm d}{x_t}}}{{{{\rm d}t}}} = {a_1} $$ (3) where a0 is a constant and a1 is the climatic trend rate.
According to regression theory:
$$ {a_1} = {r_{\rm xt}}\frac{{{\sigma _x}}}{{{\sigma _t}}} $$ (4) whereσx is the mean variance of element x and σt is the mean variance of the series (1, 2, 3 …., n). We therefore obtain the climatic trend rate based on the climatic trend coefficient rxt. The scope of the change in meteorological elements is shown well by the climatic trend rate.
2.1. Data
2.2. Methods
-
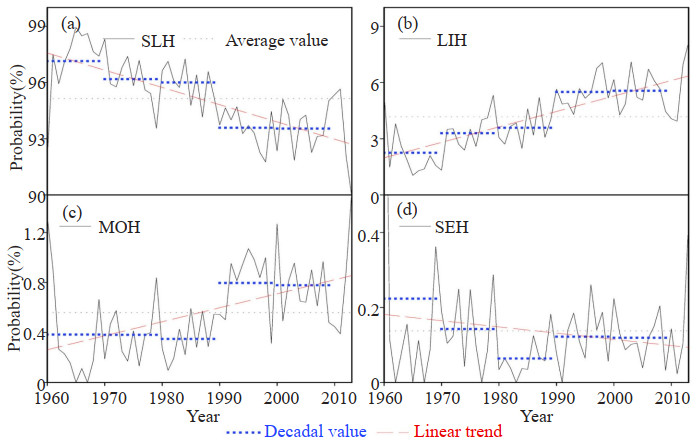
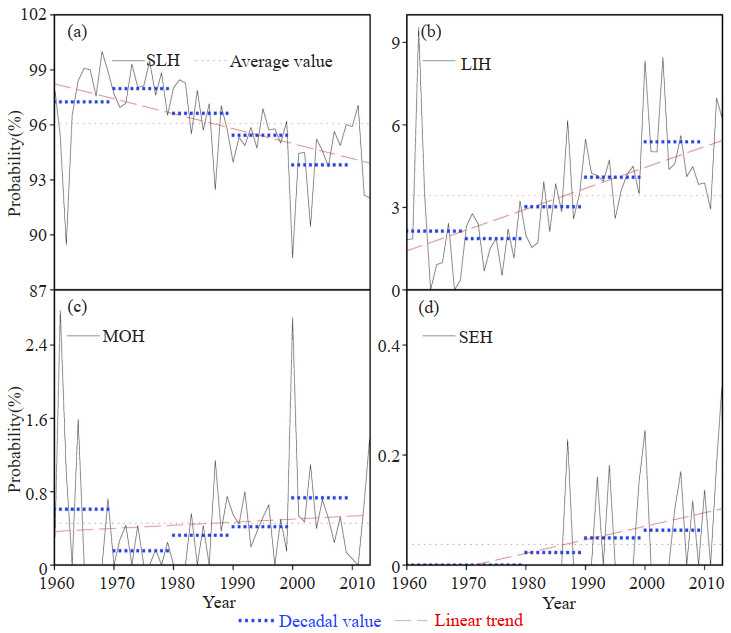
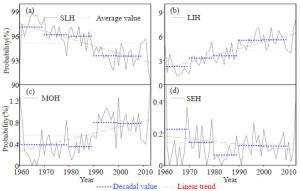
Figure 2 shows the variations in the temporal probabilities of the four grades of haze days at all stations averaged over the time period 1960-2013. The annual mean probabilities are 95.138, 4.166, 0.559 and 0.137% for SLH, LIH, MOH and SEH days (Table 1), respectively. Fig. 2a shows that the probability of SLH days is > 90% and this decreases steadily from 1960 to 2013 with a regression coefficient of - 0.903%·(10 years)-1 (Table 2). The trend coefficient is - 0.699, which passes the 99.9% confidence level. By contrast, the probability of LIH days is < 10% and this shows a significantly increasing trend during the study period (Fig. 2b). The regression coefficient and trend coefficient are 0.809%·(10 years)-1 and 0.753, respectively, and the trend coefficient passes the 99.9% confidence level.
Grade Standard deviation (%) Trend coefficient Regression coefficient (%·10 years-1) P(%) Slight haze days 2.052 -0.699 -0.903 99.9 Light haze days 1.706 0.753 0.809 99.9 Moderate haze days 0.355 0.492 0.11 99.9 Severe haze days 0.187 -0.138 -0.016 Not significant Table 2. Statistical summary of the probability of the four grades of haze days over China.
Unlike the probabilities of SLH and LIH, the change trends in the probability of MOH and SEH days show a clear interdecadal fluctuation during the past 54 years. The lowest value for the probability of MOH and SEH days is in the 1980s. The probability of MOH shows a weak decreasing trend before 1990 and increases rapidly from 1990 to 1993. The probability of SEH decreases rapidly before 1990 and then shows a smooth change trend after 1990. However, the change trends of the probability of MOH and SEH days are different. The probability of MOH days shows a significant upward trend and the trend coefficient is 0.492, passing the 99.9% confidence level in a statistical t-test. Conversely, the probability of SEH days shows a slight downward trend, but the trend coefficient value does not pass the 99.9% confidence level of the t-test.
-
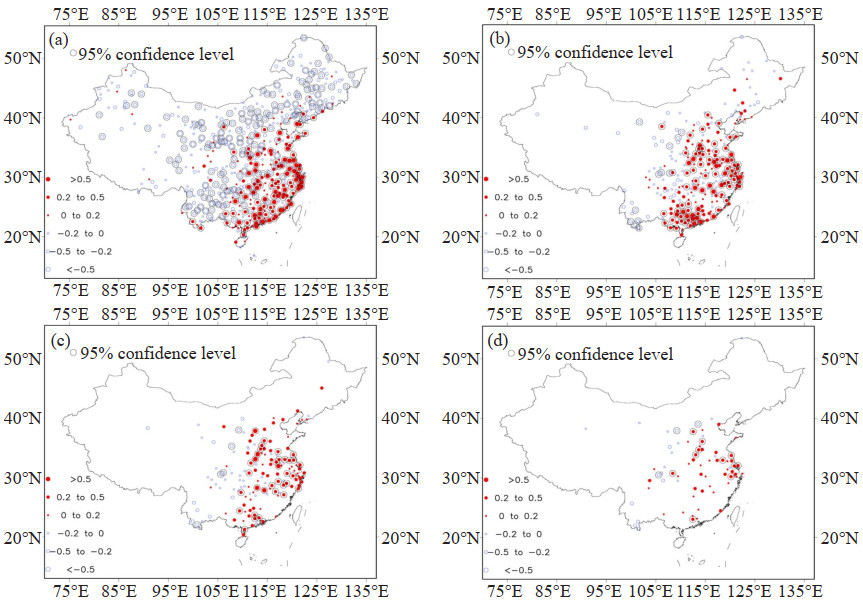
Figure 3 shows the spatial patterns of the trend coefficient of the probabilities of the four grades of haze days. The regions with an increasing probability of SLH days are mainly distributed to the east of 105°E and the south of 42° N (Fig. 3a) and include eastern China, southern China, central China and northern China. Most stations pass the 95% confidence level in the statistical t-test. The regions showing a decreasing trend are northwestern China, southwestern China and northeastern China. The values of the trend coefficient in the Pearl River Delta (PRD) and the Yangtze River Delta (YRD) can be up to 0.5. This can be attributed to the serious air pollution in these two regions resulting from the rapid industrialization and urbanization. Overall, this spatial distribution of the probabilities of SLH days is similar to the annual mean number of haze days[10].
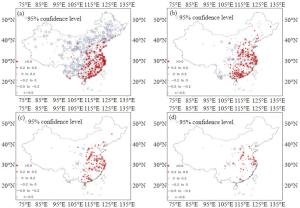
Figure 3. Trend coefficients for the probabilities of four grades of haze days from 1960 to 2013 for the probability of (a) SLH days, (b) LIH days, (c) MOH days and (d) SEH days.
Figure 3b shows the increasing probability trend for LIH days in eastern China and the southeastern coastal regions. The trend coefficient of most stations passes the 95% confidence level in the statistical t-test, especially in the YRD, PRD and the southern Beijing-Tianjin-Hebei (BTH) regions, which are the most seriously polluted regions in China with the lowest visibility as a result of haze [20, 21]. Most of the stations in northwestern China do not record haze pollution at the LIH grade; LIH days are recorded at only a few sites in northern China, central China, the Sichuan Plateau and Yunnan province, where the probability of LIH days shows a slight decrease with small trend coefficients.
Figure 3c shows the spatial distribution of the probability of MOH days, which is very similar to Fig. 3b, although fewer stations record haze pollution at the MOH grade. The probability of MOH days in the southern BTH, YRD and PRD regions also passes the statistical t-test at the 95% level. Fig. 3d shows the trend coefficient for the probability of SEH days for the BTH, Sichuan Plateau, YRD and PRD regions. Only a few of these results pass the 95% confidence level in the statistical t-test.
3.1. Temporal characteristics of the probabilities of the four grades of haze
3.2. Spatial characteristics of the probabilities of the four grades of haze
-
This analysis shows that the probabilities of the four grades of haze days have undergone different change trends under the background of increasing air pollution in China. However, the spatial patterns (Fig. 3) show that the probabilities of the four grades of haze days in the BTH, YRD and PRD regions have a clearer increase, mainly due to the increasing consumption of resources, leading to serious environmental impacts. To investigate the impact of human activities on the probabilities of the four grades of haze days further, the 543 stations are divided into stations in large, medium and small cities according to the amount of pollution[22]. On the basis of the population in 2005, large, medium and small cities are defined as having > 1, 000, 000, 500, 000-1, 000, 000, and < 500, 000 people, respectively. The small cities are further divided into S1 and S2. S1 refers to small cities geographically close to large or medium cities (within a radius of 0.8°) and S2 refers to small cities > 1.5° from a large of medium city. Based on these criteria, 157 large cities, 83 medium cities, 151 S1 cities and 114 S2 cities are selected.
Figure 4 shows the annual variation in the probabilities of the four grades of haze days in large cities. The probability of SLH days in large cities decreases steadily during the study period and the trend coefficient value is - 0.801, passing the 99% confidence level (Table 3). The probability of LIH days in large cities is < 10% and increases over the nearly 54 years of the study period with a high trend coefficient value (0.826). The probability of MOH days increases before the mid-1990s and then decreases and its trend coefficient passes the 99% confidence level. The probability of SEH days is < 0.6% and shows a weak upward trend from 1960 to 2013, but the trend coefficient does not pass the 99% confidence level. These results indicate that under conditions of increasing atmospheric pollution in China, the intensity of haze pollution also increases significantly in large cities [23, 24].
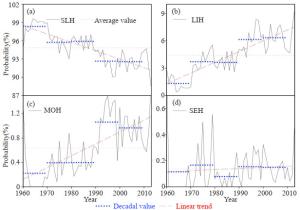
Figure 4. Annual variation of the probability of the four grades of haze days in large cities from 1960 to 2013.
City size Slight haze days Light haze days Moderate haze days Severe haze days Large -0.801c 0.826c 0.651c 0.077 Mediums -0.522c 0.568c 0.089 0.482c Small (S1) -0.225a 0.347b 0.046 -0.286b Small (S2) 0.348b -0.338b -0.215 -0.213 a Denotes the trend coefficient passing the statistical test at the 90% confidence level; b Denotes the trend coefficient passing the statistical test at the 95% confidence level; c Denotes the trend coefficient passing the statistical test at the 99% confidence level. Table 3. Trend coefficients for the probabilities of the four grades of haze days in China.
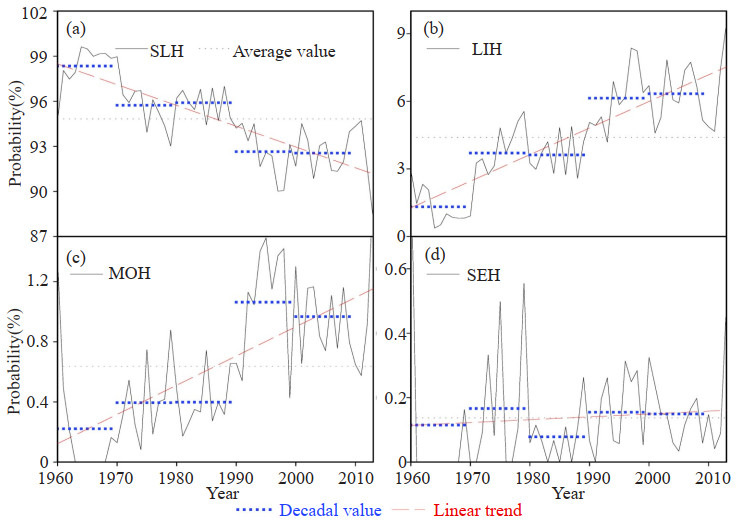
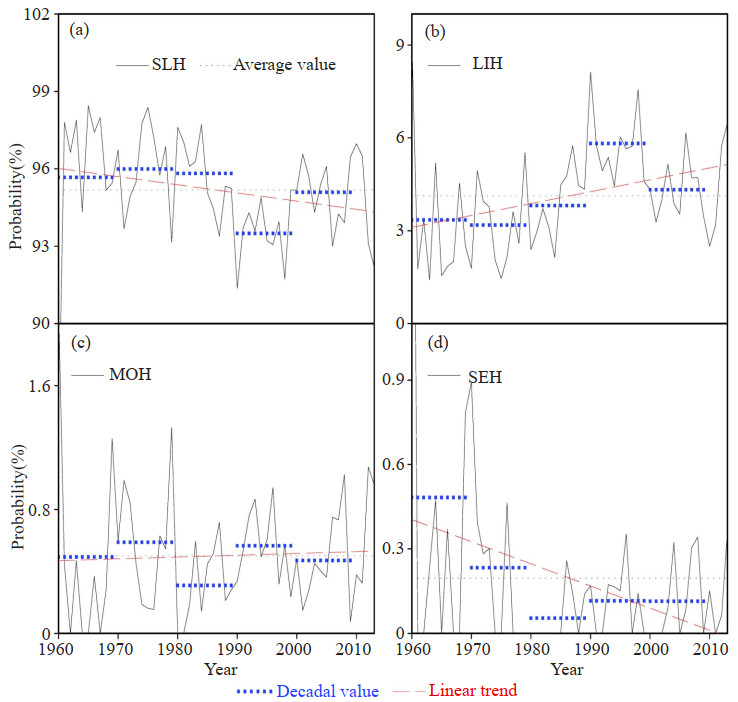
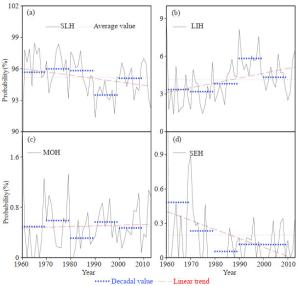
Figure 5 shows the temporal changes in the probabilities of the four grades of haze days in medium cities. The probability of SLH days shows a slight upward trend from the early 1960s to the late 1970s and then decreases steadily from the late 1970s. By contrast, the probability of LIH days in medium cities declines in the 1960s and 1970s and shows an increasing trend after the late 1970s. The trend coefficients of the probabilities of SLH and LIH days are - 0.522 and 0.568, respectively, and pass the 99% confidence level in the statistical t-test. The probability of MOH days in medium cities shows a clear interdecadal fluctuation over the past 54 years, with a decreasing trend from 1960 to 1980, a rapid increase after 1980 and a peak in 2000, followed by a decreasing trend. Fig. 5d shows that there were no SEH days before the mid-1980s, but the probability of SEH days shows a clearly increasing trend after the late 1980s. The high trend coefficient (0.482) of SEH days in medium cities passes the 99% confidence level in the statistical t-test.
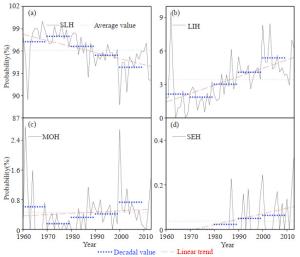
Figure 5. Annual variation of the probability of the four grades of haze days in medium cities from 1960 to 2013.
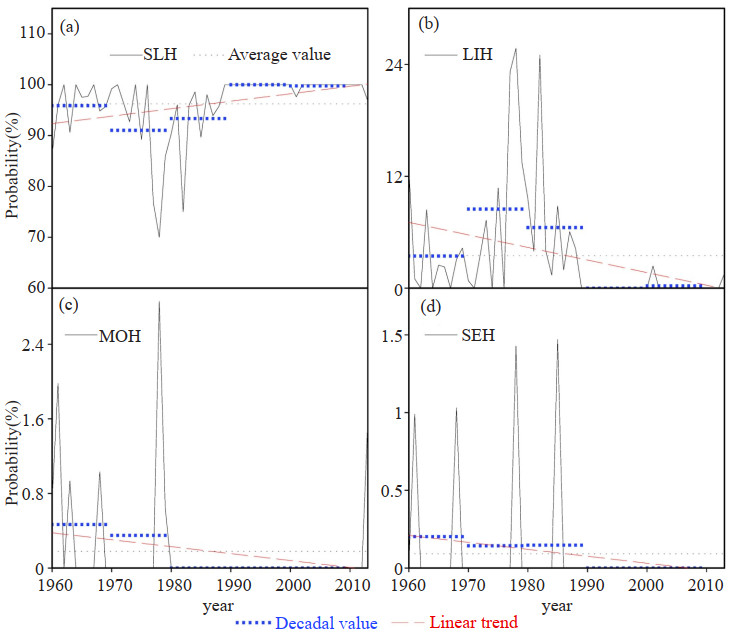
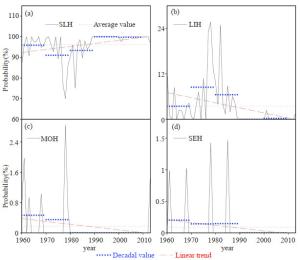
Figures 6 and 7 show the temporal variations in the probabilities of the four grades of haze days in S1 and S2 cities, respectively, from 1960 to 2013. The probability of SLH days in S1 cities is > 90% and has been decreasing steadily, as in large and medium cities, with the trend coefficient (- 0.225) passing the 90% confidence level. This suggests that large and medium cities have a considerable impact not only on the local air quality, but also on the regional atmospheric chemistry [21]. By contrast, the probability of SLH days in S2 cities shows an increasing trend and the probability of SLH days reaches 100% after 1990, which means that other grades of haze days do not occur in S2 cities after 1990. The probability of LIH days in S1 cities tends to increase from the early 1960s to the late 1990s and then decreases after 2000. There is no clear change trend of the probability of MOH days, with an average value of 0.5. The probability of SEH days in S1 cities decreases rapidly during the study period. There are LIH, MOH and SEH days in S2 cities before 1990, but the probabilities are small. More attention should be paid to the high probability and increasing trend of SLH days.
-
The probability of haze days and daily visibility data from 543 stations in China are used to analyze the change trends during the past 54 years. Haze days are classified into four grades based on the daily visibility and the probabilities of the four grades of haze days in are investigated. The main conclusions are as follows.
(1) The main grade of haze days in China is SLH days and the average probability of SLH days is 95.138% at all 543 stations. The probabilities of the other three grades of haze days are 4.166, 0.559 and 0.137% for LIH, MOH and SEH days, respectively. The probability of SLH days shows a decreasing trend over the last 54 years with the fastest decrease of - 0.903%·(10 years)-1 and a trend coefficient of - 0.699, which passes the 99.9% confidence level. By contrast, the probabilities of LIH and MOH days have been increasing steadily from 1960 to 2013 and the trend coefficients are 0.753 and 0.492, respectively, passing the 99.9% confidence level. The lowest probability is for SEH days, which shows a slight downward trend during the study period, although the trend coefficient does not pass the statistical t-test.
(2) Spatial analysis shows that the increasing probability of SLH days is mainly distributed to the east of 105°E and south of 42°N and that most of the stations in this region pass the statistical t-test at the 95% level. The highest value of the trend coefficient is located in the PRD and YRD regions, where it can be up to 0.5. This might be attributed to the serious air pollution in this region of rapid industrialization. The increasing probability of LIH days is mainly distributed in eastern China and the southeastern coastal region; most stations in northwestern China do not show haze pollution at the LIH grade. The probabilities of MOH and SEH days are similar to the probability of LIH days, but occur at fewer stations, mainly located in the BTH, Sichuan Plateau, YRD and PRD regions and passing the statistical t-test at the 95% level.
(3) The analysis of four grades of haze days in different sizes of city suggests that the probability of SLH days in large and medium cities is > 90% and has clearly been decreasing during the study period, with high trend coefficients passing the 99% confidence level. The probabilities of LIH days in large and medium cities are < 10% and tend to increase over the 54 years. The probability of MOH days shows a clear interdecadal fluctuation, increasing before the mid-1990s and then decreasing in large cities. In medium cities, the probability of MOH days shows a decreasing trend from 1960 to 1980, increases rapidly after 1980 and then peaks in 2000, before decreasing. The probability of SEH days is the lowest of the four grades of haze days and shows a weak upward trend from 1960 to 2013 in large and medium cities, but the trend coefficient does not pass the statistical t-test. In S1 and S2 cities, SLH is the primary grade of haze days and has been decreasing steadily in S1 cities. However, the probability of LIH and MOH days in S1 cities has been clearly increasing during the last 54 years, which is attributed to the impact of large and medium cities. More attention should be paid to this phenomenon. The probability of SLH days in S2 cities shows an increasing trend and reaches 100% after 1990; the probabilities of the other three grades of haze days are small and decrease significantly.
Air pollution in China has become increasingly serious in recent years with the rapid growth of the economy and there has been a sharp decrease in atmospheric visibility [25]. Satellite data have been increasingly used in studies of atmospheric pollution with the development of satellite inversion technology [26], although conventional meteorological data from ground-based observations is still used due to the short time period over which satellite data are available.
This study presents the characteristics of the temporal variation of the probability of haze days and some limitations should be noted. Specific data for aerosols and other meteorological variables (e. g., the wind field, stratification conditions, temperature and precipitation) are not analyzed in this paper and require further study in the context of climate change. The results of this study are slightly different to those of Wu et al.[22], which may be attributed to the number of meteorological stations.



 DownLoad:


 粤公网安备 4401069904700002号
