


 DownLoad:


HTML
-
Squall lines (SLs) are banded or linear mesoscale deep convective systems that pose serious threats of fierce wind, heavy rainfall, hail and tornadoes to cities and agricultural activities, causing significant disasters (Schumacher and Johnson [1]; Trapp et al. [2]; Lombardo and Colle [3]; Ma et al. [4]; Mauri and Gallus [5]; Wan et al. [6]; Pan and Yang [7]; Fang [8]; Ninomiya [9]; Fovell and Tan [10]). Moreover, a maturing SL line often forms organized mesoscale circulations in response to sustained deep convection that further impacts system evolution (Gamache and Houze [11]; Smull and Houze [12]; Teng [13]; Letkewicz and Parker [14]; Zhu et al. [15]; Abulikemu et al. [16]). Boundary layer convergence lines, such as a cold front, gust front, sea breeze front (SBF), and dew point front, can trigger or strengthen an SL (Baker et al. [17]; Crosman and Horel [18]; Segal and Leuthold [19]; Miller et al. [20]). The collision of a gust front and an SBF can cause an increase in the magnitude of convergence at low levels, leading to the intensification of updrafts (Kingsmill [21]; Hock [22]; Clark et al. [23]). SL are continually formed at the confluence zone of a synoptic-scale cold front, and a mesoscale area with large water vapor amounts at low levels (Yoshida et al. [24]; Pan and Wang [25]; Trapp and Weisman [26]; Gao et al. [27]; Tian et al. [28]).
The dynamic interaction of the sea breeze with the environment can give rise to meteorological conditions conducive to the occurrence of thunderstorms (Azorin-Molina et al. [29]; Wang and Rogers [30]). It can enhance low-tropospheric convergence, which induces mesoscale convective systems to organize into new thunderstorm cells or trigger thunderstorms (Arritt [31]; Dailey and Fovell [32]; Fovell [33]; Wissmeier et al. [34]; Lombardo and Kading [35]; Walsh [36]). The SBF makes the inland environment more favorable for convection by bringing about persistent lifting over the coastal region. The sustained low-tropospheric shear generated by sea breeze circulation (SBC) or an SBF also plays an important role in SL intensification, as strong shear can lead to larger inflowing convectively unstable air (Alfaro [37]; Lovell and Parker [38]). The cold pool dynamics also play an essential role in the sea breeze (Chen et al. [39]; Parker [40]; Zhou et al. [41]). The strength and stratification of the cold pool are understood as important determinants of an SL's intensity, propagation speed, and longevity (Alfaro and Khairoutdinov [42]; Weisman et al. [43]; Weisman and Rotunno [44]). The underlying land surface exchanges energy with the atmosphere through sensible heat flux and latent heat flux. Surface fluxes can influence SLs by directly modifying the cold pool. The effect also consists of an earlier acceleration of the SL due to the earlier initiation of secondary convection with higher surface temperature (Peters and Hohenegger [45]).
The Shandong Peninsula is located on the western margin of the Pacific and on the eastern coast of China, and it is surrounded by the Bohai Sea to the north and the Yellow Sea to the south. Severe convective weather occurs frequently on the peninsula. Due to the influence of the diabatic heating difference between land and sea, a sea breeze often flows inlandward from 04:00 to 07:00 UTC (local afternoon) in summer and autumn. The causes of SLs may vary across different locations, particularly in cases involving extreme wind events. One such case occurred on the Shandong Peninsula on August 6, 2017. The life cycle of the SL was longer than the average for this region, the radar echo had strong bow characteristics, and it caused extreme gales with a maximum instantaneous wind velocity of 35.5 m s–1. Despite the advancements in understanding SLs from past research, several key questions remain: (1) How did the convective storms on the Shandong Peninsula rapidly organize from an ordinary single storm into an intense SL event? (2) What were the underlying causes of the extreme gales associated with this SL? (3) How did the sea breeze and gust front contribute to the triggering of the SL? In the present study, the authors analyzed these questions through a comprehensive synoptic analysis incorporating radar observations, sounding data, surface meteorological measurements, and reanalysis information.
-
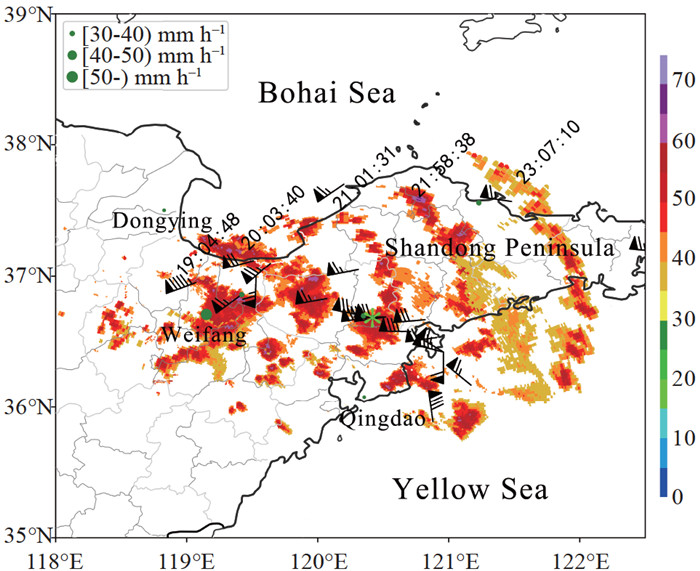
An SL event occurred on the Shandong Peninsula from west to east on the afternoon of August 6, 2017, and the process caused severe damage accompanied by strong thunderstorm gales, hail, short-term heavy rainfall, and serious losses to local agriculture. In this process, there were 19 stations that recorded winds reaching force 10–11 and 2 stations that recorded winds reaching force 12 or above. The maximum wind speed recorded by Weifang Station was up to 37 m s–1 at 11:05 UTC, and the wind speed recorded by Xiagezhuang Station was 35.5 m s–1 at 12:55 UTC when the SL passed (Fig. 1). The rainfall at 31 stations reached the magnitude of a rainstorm, and the maximum precipitation reached 52.9 mm h–1 from 10:00 to 11:00 UTC. Obviously, the main locations of extreme gales were the bow area of the radar echo along the movement direction of the SL.

Figure 1. The radar echo positions of the SL from 11:04 to 15:07 UTC on August 6, 2017. The colored shading represents the composite reflectivity echoes above 40 dBZ at different times, the wind barbs are gusts greater than force 10, the dark green dots are 1-hour precipitation above 30 mm h–1. At Weifang Station, 1-hour precipitation exceeded 50 mm h–1, and the light green * indicates the location of Xiagezhuang Station.
-
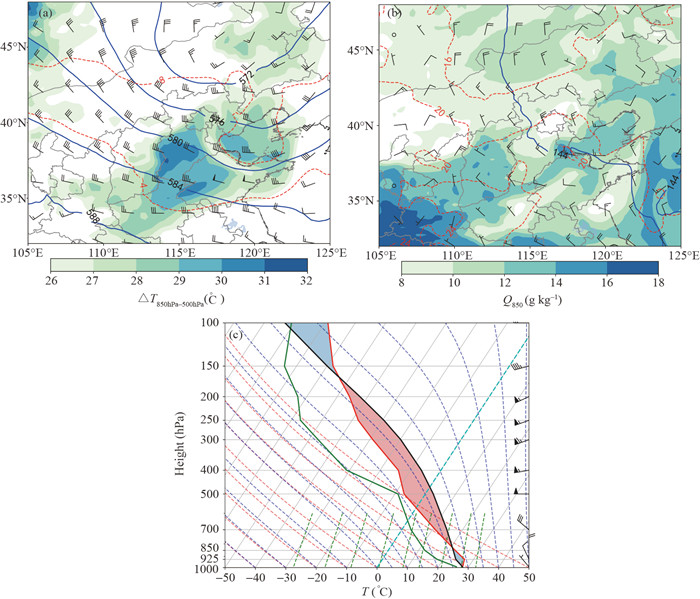
At 00:00 UTC on August 6, a cold vortex occurred on the northeastern Shandong Peninsula at 500 hPa (Fig. 2a), and the temperature of the cold center (50°N, 122°E) was –11℃. At 850 hPa (Fig. 2b), a warm area with a temperature higher than 20℃ was observed. The temperature difference between 850 hPa and 500 hPa was higher than 28℃, and the specific humidity at 850 hPa was greater than 10 g kg–1. The radiosonde analysis showed that the convective available potential energy (CAPE) at Qingdao Station at 20:00 UTC exceeded 3700 J kg–1. The 0–6 km vertical wind shear was 20 m s–1, while the 0–3 km wind shear was 12 m s–1 (Fig. 2c).

Figure 2. The synoptic situation on August 6, 2017. (a) 500 hPa map and T850hPa–500hPa (colored shading) at 00:00 UTC, (b) 850 hPa map and specific humidity (colored shading) at 00:00 UTC, and (c) Qingdao sounding map at 20:00 UTC.
-
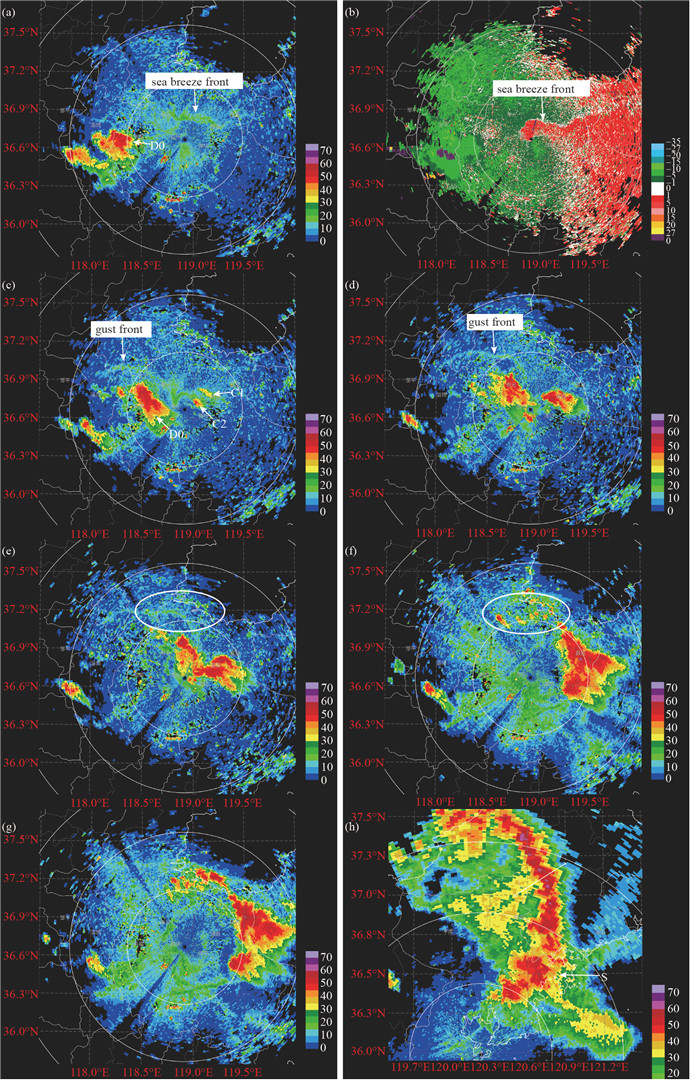
Isolated heat convection formed over the eastern Shandong Peninsula at approximately 07:50 UTC (local afternoon). Then, the convective cell moved northeastward under the upper-level guiding airflow, and its scale gradually increased; this cell intensified and evolved into a strong storm (marked as D0 in Fig. 3). The echo shape of storm D0 was massive at 09:24 UTC (Fig. 3a), and the maximum intensity reached 63 dBZ. Meanwhile, there was an obvious narrow-band echo approximately 25 km north of the Weifang Radar Station. It gradually advanced southward inland, with an intensity ranging between 15–20 dBZ. The echo was 40 km long and exhibited an east–west oriented radial velocity (Fig. 3b).

Figure 3. (a, and c–h) The radar reflectivity and (b) velocity at 0.5° elevation at Weifang Station. (a) 09:24 UTC, (b) 09:24 UTC, (c) 10:05 UTC, (d) 10:29 UTC, (e) 10:47 UTC, (f) 11:22 UTC, (g) 11:40 UTC, and (h) 13:24 UTC on August 6, 2017.
This narrow-band echo was the convergence line of the SBF produced by the northerly sea breeze on the southern coast of the Bohai Sea at 09:24 UTC (Fig. 3b), and the intensity of the convergence line increased during propulsion. The storm D0 reflectivity factor was 65.5 dBZ (Fig. 3c), it reached an altitude of 11–12 km, the vertically integrated liquid water content was 51 kg m–2, and the three-body scatter spike was obvious at 9.9° elevation at 10:05 UTC. A northeast‒southwest convergence line near Weifang was formed by the northeast wind and the south wind of the background wind. It intersected with the eastern section of the SBF at approximately 10:00 UTC, triggering convective cells C1 and C2 (Fig. 3c). C1 and C2 merged after rapid development and then formed a discontinuous quasi-east–west convective echo band with a strong storm (Fig. 3d). The movement speeds of C1 and C2 were different from that of D0. Storm D0 moved northward quickly, while convective cells C1 and C2 developed along the convergence line, achieving a quasistatic state, so the east‒west echo zone gradually turned into a northwest‒southeast convection band (Fig. 3e). At the front of the D0 movement (the north side of the storm), a gust front near the east‒west direction was generated (in the ellipse in Fig. 3e). Several weak convective cells were excited by the gust front (in the ellipse in Fig. 3f). Then, these weak convective cells strengthened slowly and gradually became a single cell (Fig. 3g). Finally, the SL main echo area was formed by the combination of weak cells, convective cells C1 and C2 and strong storm D0 (Fig. 3h).
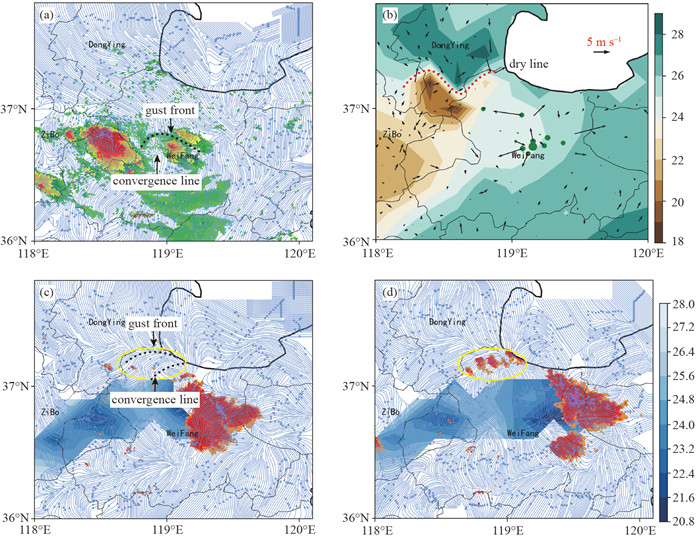
The gust front and convergence line can be clearly seen from the radar echo map superimposed on the flow field (Fig. 4a). There was also a northeast‒southwest dew point front zone (i.e., dry line) at the border between Dongying and Weifang at 11:10 UTC, the local temperature on the south side of the front zone was 18–20℃, the temperature on the north side was 28–30℃, and the dew point temperature difference was up to 10℃ within 8 km (Fig. 4b). The wind directions on both sides of the dew point front converged. At the same time, there were three streams from different directions near the zone, forming a convergence line (Fig. 4c). The gust front of storm D0 moved to the northern coast and intersected with the convergence line during the movement. A series of convective storms were triggered and developed along the convergence line of the gust front, forming the northern part of the SL echo zone (Fig. 4d). The northern echo zone and the main echo of the SL moved eastward and merged, resulting in the enhancement of thunderstorm intensity. The SL system was approximately 200 km long with a typical bow structure. The structure of the SL was complete, with a strong reflectivity factor gradient in the front and a weak echo channel in the back. The height of the echo top was higher than 14 km, and the reflectance was above 60 dBZ. A supercell storm was embedded in the south of the SL (the "S" in Fig. 3h).

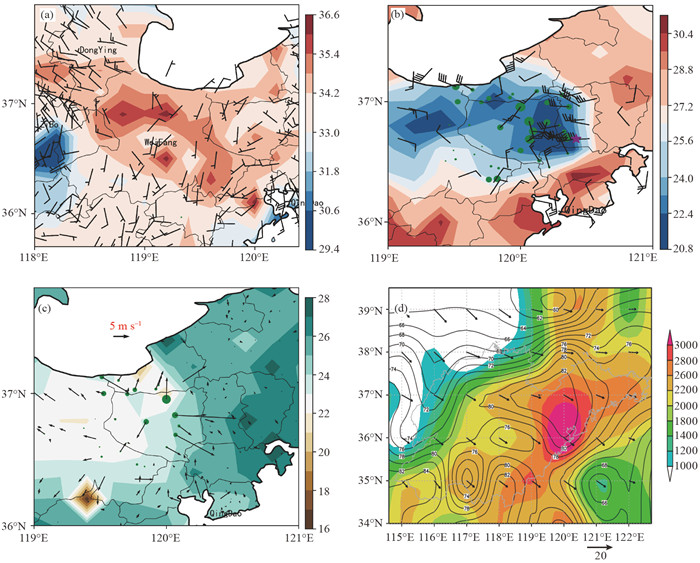
Figure 4. The analysis fields of the intensive observational elements and radar echo on August 6, 2017. (a) Surface flow field and radar echo (colored shading is the combined reflectivity above 15 dBZ) at 10:00 UTC, (b) dew point temperature (colored shading), wind field (arrow) and precipitation (green dot) at 10:00 UTC, (c) surface flow field, temperature (cool shading) and radar echo (warm shading is the combined reflectivity above 40 dBZ) at 11:10 UTC, and (d) the same as (c) but at 11:30 UTC.
The above analysis shows that the SL process from convective triggering to initial formation was mainly affected by the convergence line of the SBF. The convergence line moved southward, triggering new convective cells in the eastern SL section. It then combined with the thermal convection echo, forming the main echo of the SL. In the later stage, the convergence line of the gust front interacted with other convergence lines and formed the final form of the SL under favorable water vapor conditions and unstable atmospheric stratification. Therefore, the convergence line of the gust front was the main driving and triggering mechanism of the echo in the northern part of the SL, which was essential in shaping the linear structure of the SL. In brief, the inland penetration of the SBF caused the strengthening of low-tropospheric convergence and vertical velocity, and SBC provided the upward transport of moist air and abundant water vapor supply, finally leading to an increase in latent heat release and energy accumulation. These environmental conditions were good for triggering and development of SLs. Moreover, the unique topography and mountains of this coastal region easily caused uplift and convergence, which might also contribute to the triggering of the SL.
-
The SL reached the mature stage at 12:00 UTC, and its southern part entered the sea area at approximately 13:50 UTC and then began to weaken and disappear at approximately 16:30 UTC. Its northern part entered the eastern sea area of the peninsula at approximately 14:40 UTC, and its middle part affected the sea area east of the peninsula at approximately 16:20 UTC and then gradually weakened. For the whole process, the life cycle of the SL took approximately six and a half hours from genesis to lysis. Before the formation of the SL, the surface of most areas of Shandong Province featured a southerly wind current field, the sea breeze on the south coast of the Bohai Sea pushed inland to the northern coastal area of Weifang, and the wind along the coast of this area gradually turned northerly (Fig. 5a). At this time, convective cells appeared to the east (Fig. 4a). After the formation of the linear main body of the SL, the surface observation data showed that there were thunderstorm-related high pressure and a strong cold pool behind the SL (Fig. 5b).

Figure 5. Analysis chart of data from the automatic surface observation station and NCEP reanalysis data on August 6, 2017. (a) Temperature (colored shading), wind field (barb) and precipitation (green dot) at 09:00 UTC; (b) the same as (a) but at 12:50 UTC; (c) dew point temperature (colored shading), wind field (arrow) and precipitation (green dot) at 12:20 UTC; (d) CAPE (colored shading), 0–6 km wind vector (arrow) and 850 hPa θse (black solid line) at 12:00 UTC.
In this season, the suitable thermal, water vapor and vertical wind shear conditions of the Shandong Peninsula are favorable for the maintenance of an SL. The dew point temperature was 25–28℃, and the water vapor at low levels was abundant, which provided a good high-humidity environment for the maintenance of the SL (Fig. 5c). The surface temperature in the northern region of the peninsula remained above 30℃ after 12:00 UTC, the CAPE value was more than 3000 J kg–1, and there was a high energy tongue of θse at 850 hPa (Fig. 5d), which indicates that the atmosphere had strong stratification instability at this time. At 12:00 UTC, the low-level vertical wind shear increased significantly, and the 0–6 km vertical wind shear was higher than 20 m s–1 (Fig. 5d), which was an important driving force for the SL strength development and structural change.
In brief, the convergence and uplifted movement near the surface were driven by the interaction from the cold pool, the outflowing northwest wind generated by the SL and the southeast wind in front of the system, and the favorable water vapor, unstable energy and wind vertical shear conditions in this area were conducive to the maintenance of the SL.
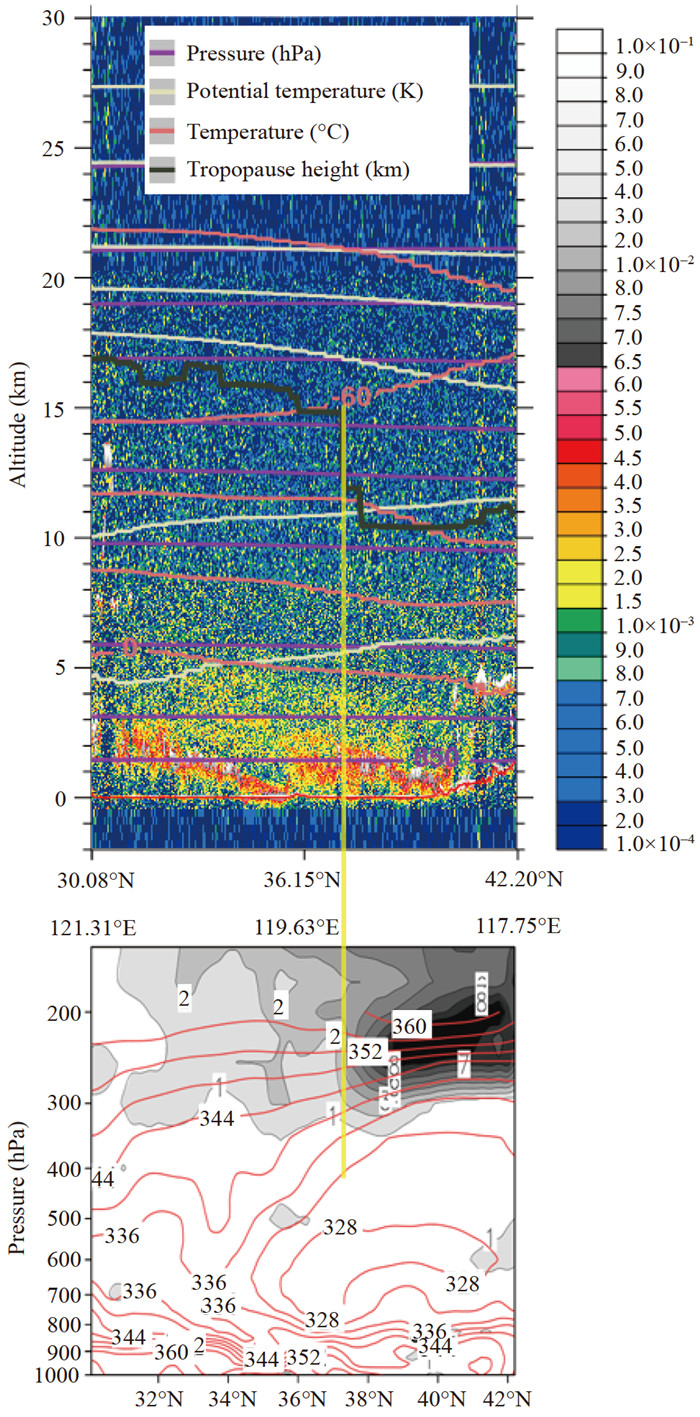
The dynamic tropopause folding north of the SL was obvious, and the monitoring result of the CAPLISO satellite was entirely consistent with the analysis result of potential vorticity (PV) (Fig. 6). The satellite just passed through the northern part of the SL during 05:18:15–05:31:43 UTC. The height of the tropopause was steeply reduced from 15 km to 10 km in the interval of 37°–38°N in the product of the 532 nm total attenuated backscatter. The dynamic tropopause (the isoline of PV = 2 PVU) represented by PV also dropped sharply from 230 hPa to 300 hPa in this region. Then, tropopause folding increased, reaching the strongest state at 05:00 UTC, and the 2-PVU isoline stretched downward to 400 hPa. It can be seen from the yellow line in Fig. 6 that the tropopause folding phenomenon analyzed by using these two data was very consistent in time, location and depth of the 2-PVU isoline. Tropopause folding had two effects. On the one hand, the sinking of dry and cold air from the upper troposphere resulted in the enhancement of baroclinicity in the middle and upper troposphere, which easily caused convective instability and was conducive to the development and enhancement of severe convective weather. On the other hand, a cyclonic circulation was triggered with an advantage by large positive PV in the middle and upper troposphere due to the positive correlation between PV and relative vorticity, which was beneficial to the strengthening of the low-pressure system.

Figure 6. (a) The result of CAPLISO satellite detection from 05:18:15–05:31:43 UTC, and (b) the south‒north section of PV (shaded) and potential temperature (red line) at 05:00 UTC from ERA5 reanalysis data of the European Centre for Medium-Range Weather Forecasts.
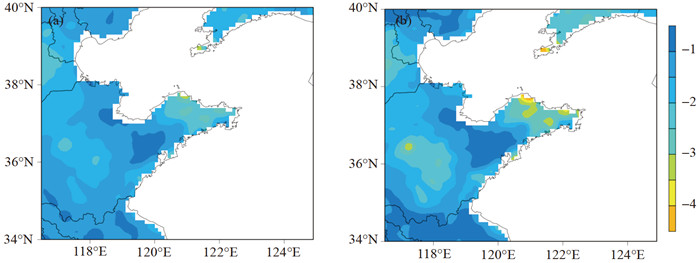
The positive PV anomaly at low levels is mainly caused by the sensible heat flux of the underlying surface (Wang and Rogers [13]). The evolution of sensible heat flux in this process showed that the sensible heat flux was higher than that in the surrounding area, its absolute value was larger at 06:00 UTC (Fig. 7a), and this area was also the path that the SL passed through in the western peninsula. The range and intensity of the sensible heat flux both increased, and the high value of the sensible heat flux was maintained over time in the generation and maintenance stages of the SL system (Fig. 7b). Meanwhile, the high sensible heat flux in the low troposphere was conducive to convective instability, which was conducive to the maintenance of the SL. Notably, the flux data used in this paper were for the underlying surface, so for the atmosphere, the flux value was negative.

Figure 7. The surface sensible heat flux at (a) 06:00 UTC and (b) 11:00 UTC.
4.1. Triggering and organization
4.2. Maintenance mechanism
-
Surface observation data showed that there was thunderstorm-related high pressure and a strong cold pool behind the SL (Fig. 5b). The evaporation- and melting-induced cooling process of precipitation particles had an important influence on the formation of the cold pool and the generation of gales at the surface, and the strong cold pool also played an important role in the generation of disastrous gales.
In this process, there was short-term heavy rainfall at 31 observation stations, with a maximum rainfall intensity of 52.9 mm h–1 (Weifang Station, 02:00–03:00 UTC). The pulling force of precipitation particles in the falling process and the evaporative cooling in the relatively dry and cold air at the middle level both aggravated the downdraft. The Qingdao sounding (Fig. 2) data showed that there was a strong westerly flow of 20 m s–1 near 500 hPa, which led to a large amount of dry and cold air entrained into the SL. Because of the low humidity in the middle levels, when the raindrops passed through the unsaturated air layer, remarkable melting, evaporation, or sublimation occurred. These processes can absorb immense amounts of heat, form negative buoyancy and accelerate air sinking, which led to a sharp drop in surface temperature and promoted the development of surface gales and a cold pool.
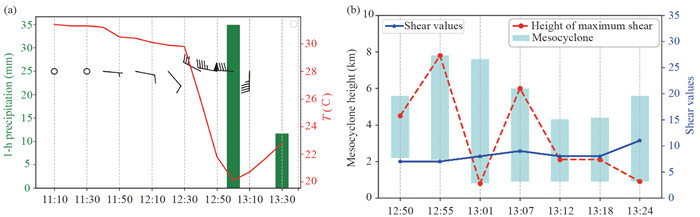
The heavy rainfall led to a strong cold pool over the surface, which rendered the isotherm lines at the front being very dense. The temperature of the cold pool was lower than 20℃, but in front of the gust front, it reached more than 30℃. The maximum temperature difference within 20 km was up to 13℃, so the density flow was relatively strong (Fig. 5b). Xiagezhuang Station (represented by the light green * in Fig. 1) recorded a 35.5 m s–1 gust at 12:55 UTC. With this station as an example, the relationship between a strong cold pool and gales during the impact of an SL was studied. Short-term heavy rainfall occurred at 13:00 UTC with a rainfall of 34.9 mm h–1, while the surface temperature dropped from 29.8℃ at 12:30 to 20.1℃ at 13:00 (Fig. 8a). In the early stage of severe convection, the surface allobaric field was mainly negative and was approximately –1.5 hPa near the severe convection area. In the later stage, after the formation of the strong cold pool at the surface, the scope expanded rapidly and advanced from west to east. A positive surface allobaric value appeared at 12:00, and the center was +2.5 hPa h–1, indicating that the surface of the area was controlled by downdraft, and then the surface pressure rose. The sinking divergent airflow of the convective cell was superimposed on the density flow, resulting in a disastrous gale. The gust was consistent with the thunderstorm-related high pressure and the strong cold pool when the SL passed through. The high-density cold air of the cold pool and the thunderstorm-related high strengthened the surface divergent outflow velocity.

Figure 8. The physical quantity time series diagram of Xiagezhuang Station on August 6, 2017. (a) Temperature (red solid line), maximum gust and 1-hour precipitation (green histogram), and (b) the evolution characteristics of the mesocyclone parameters in supercell storm S.
The supercell storm S was embedded on the south side of the SL (the red area marked by "S" in Fig. 9a). It was noted that the rapid decrease in air pressure accompanied by the development of a low-level mesocyclone led to a strong downdraft inside the supercell storm. The time of the gale with force 10 or above was between 12:17 and 13:35 UTC at Qingdao Station. The radial velocity products in the low level had no obvious characteristics of large radial velocity or strong divergence because the movement direction of the storm was perpendicular to the radial velocity of the Qingdao radar in this position. The mesocyclone appeared in 7 continuous volume scans from 12:50 to 13:24 UTC. The bottom height of the mesocyclone decreased continuously 2–3 volume scans ahead of the gale occurrence, and the bottom height remained between 0.8 km and 0.9 km starting at 12:50 UTC (Fig. 8b). In this process, the development of the low-level mesocyclone led to a rapid decrease in local pressure and formed obvious vertical gradients of pressure disturbance, which was conducive to inducing surface gale weather.

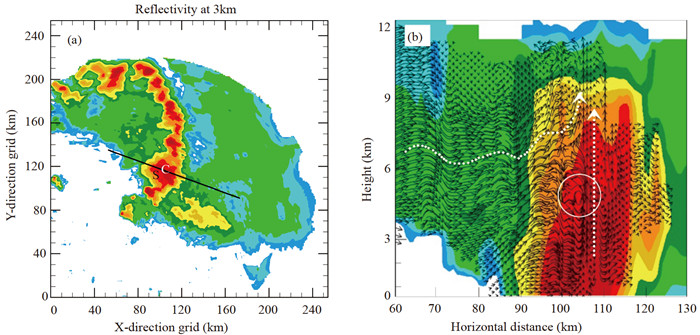
Figure 9. The reflectivity factor (shaded) and the winds inverted from the dual polarimetric Doppler radar in the profile at 13:00 on August 6, 2017. (a) Horizontal composite reflectivity, and (b) profile along the black line in (a). "S" in (a) represents the supercell storm S embedded on the south side of the SL, "C" in (a) is the position of the mesocyclone, and the white circle in (b) is the position of the horizontal vortex tube.
The wind field of the dual-polarization radar was inverted using the software of CEDRIC developed by the National Center for Atmospheric Research (NCAR). The area for wind field inversion analysis was the area within the scanning range of two SA radars in Weifang and Qingdao, with a distance of approximately 140 km. First, the software of SPRINT developed by NCAR was used to interpolate the radar volume scan data from the polar coordinate system to the Cartesian coordinate system (the bilinear interpolation method was used for data interpolation), and the radial velocity was locally deblurred. Then, the volume scan data with the same observation time (the difference was less than 3 min) of the two radars were selected for 3D wind field inversion. A vertical section along the black solid line in Fig. 9a shows that the horizontal vortex tube appeared at a height of 4–5 km in the middle level at approximately 13:00 UTC, passing through supercell storm S (Fig. 9a). The horizontal vorticity transformed to vertical vorticity with the intensive updraft development, so a mesocyclone formed in the middle and low levels. Consequently, with the continuous reduction of the mesocyclone bottom height in the middle level, it strengthened the surface gale.
Moreover, the SL moved quickly, reaching 50 km h–1 on average. The gusty wind was mainly north wind, and its direction was consistent with the SL movement direction. Thus, the rapid movement of the SL and the superposition of environmental wind and airflow both played certain roles in the generation and development of the surface gale.
-
The triggering and strengthening factors of this SL process were mainly mesoscale convergence lines. In its early stage, the main echo of the SL was formed by the convergence line of the SBF, which was then combined with thermal convection. Then, the gust front interacted with other convergence lines, triggering a series of convections on the north side of the main echo and forming the mature form of the SL. Mesoscale convergence lines such as the SBF, gust front and dry line played important roles in SL formation. Notably, the SBF had good indicative significance for severe convective weather warnings.
The reason why the SL was maintained was favourable environmental conditions. The suitable thermal, water vapor, and vertical wind shear conditions on the peninsula were all beneficial to the maintenance of the SL. Before the SL occurrence, the folding phenomenon of the tropopause had been strengthening, and the tropopause was below 400 hPa. The folding of the tropopause resulted in the strengthening of the baroclinic property in the middle and upper troposphere. The high sensible heat flux at the surface easily produced a positive potential vorticity anomaly in the lower layer, resulting in convective instability, which was conducive to the maintenance of the SL.
The formation of a surface gale was the result of the comprehensive influences of many factors. The gravity dragging effect of heavy precipitation, evaporative cooling in the relatively dry and cold air in the middle layer exacerbated the downdraft. In the convective system of the SL, when the precipitation material passed through the unsaturated air layer, it evaporated, melted or sublimated strongly, resulting in a cooling effect, forming negative buoyancy, accelerating the sinking of the air, and promoting the maintenance and development of the surface gale and cold pool. A supercell storm was embedded in the southern portion of the SL echo. The rapid reduction in air pressure accompanied by the development of a low-tropospheric mesocyclone led to a strong downdraft. The base height of the mesocyclone was constantly decreasing, ranging between 0.8–0.9 km. The development of the low-tropospheric mesocyclone led to the rapid reduction in the local air pressure, which was conducive to the triggering of the surface gale.

 粤公网安备 4401069904700002号