


 DownLoad:


HTML
-
Heatwaves, identified as an extended period of anomalously high temperatures (Fischer and Schär [1]; Perkins and Alexander [2]), potentially exert overwhelming impacts on human societies and ecosystems (Westerling et al. [3]; Thornton et al. [4]; Meng et al. [5]; Rübbelke and Vögele [6]; Coumou and Rahmstorf [7]; Lesk et al. [8]). For example, the devastating hot summer of 2003 caused around 40, 000 heat-related deaths and sizable agricultural production losses across Europe (Fouillet et al. [9]; García-Herrera et al. [10]; Laaidi et al. [11]). This was not occasional, and European extreme hot events recurred in 2010 (Barriopedro et al. [12]; Dole et al. [13]), 2015 (Russo et al. [14]; Duchez et al. [15]), and 2022 (Wang et al. [16]). Another example in Southwest China in 2022 featured extreme heatwaves associated with droughts and wildfires, brought about rippling socioeconomic and environmental impacts, including drinking water shortage, agricultural loss, electricity crunch and human health risk (Chen et al. [17]). On a global scale, heat extremes draw world-wide concerns, since both their intensity and frequency show increasing trends in the recent warming decades (Perkins et al. [18]; Coumou and Rahmstorf [7]; Mazdiyasni and AghaKouchak [19]; Perkins and Lewis [20]; Rousi et al. [21]) and are expected to increase continuously in the future roasting climate (Meehl and Tebaldi [22]; Coumou and Robinson [23]; Christidis et al. [24]; King and Harrington [25]; Zhang et al. [26]).
Compared with a single extreme weather event, compound or multiple events have recently sparked stronger scientific interests because amplified societal impacts are often observed for such concurrent extremes (Zscheischler and Seneviratne [27]; Sarhadi et al. [28]). Several studies have revealed that recurring concurrences of climate extremes are not in coincidence, including extreme rainfall synchronization (Boers et al. [29–31]; Gupta et al. [32]; Su et al. [33]), heatwave-flood teleconnection (Lau and Kim [34]; Capua et al. [35]), compound drought and heatwave events (Mazdiyasni and AghaKouchak [19]; Li et al. [36]; Mukherjee and Mishra [37]), and concurrent heat extremes along the mid-latitude westerly jet streams in the Northern Hemisphere (Kornhuber et al. [38, 39]). Kornhuber et al. [39] indicated that heat extremes over Eastern Europe and East Asia occurred nearly simultaneously and were associated with the recurrent Rossby wave pattern with wave number 5. A congruous result was concluded by Yang et al. [40], despite the fact that lead-lag information on the occurrences of distant heatwaves was not discussed thoroughly in these studies. In addition, the days of European and East Asian summer heatwaves vary consistently on interannual time scales, for which the sea surface temperature anomaly in the Atlantic Ocean is a common driver (Zhou and Wu [41]; Deng et al. [42]).
However, the lead-lag relationship between the occurrences of European and East Asian heatwaves on synoptic time scales is still unclear. Which happens first compared with the other? What is the time lag between their occurrences? How are they bridged between the two distant regions? This study aims to clarify the lead-lag concurrences of heat extremes over Eurasia and the responsible physical mechanisms for heatwave teleconnection. Section 2 describes the datasets and methods used in this study. The results obtained are illustrated in section 3, followed by a summary and discussion in section 4.
-
We adopt the ERA5 reanalysis dataset (Hersbach et al. [43]) in this study. Hourly data on surface and ten pressure levels (1000, 925, 850, 700, 600, 500, 400, 300, 200, 100 hPa), with a horizontal resolution of 1.0°×1.0°, are averaged into daily means preparatory for further composite analysis. There are a total of 3956 days in our analysis period, June–July–August (JJA) of 1979–2021. Physical variables, including 2-m temperature (T2m), total cloud cover (TCC), solar radiation, multilevel atmospheric temperature, geopotential height, zonal wind and meridional wind, are analyzed in this study.
Heatwave day on a 1.0°×1.0° grid cell in land areas is identified when daily T2m exceeds its 90th percentile threshold for at least three consecutive days, as in previous studies (Fischer and Schär [1]; Perkins and Alexander [2]). The 90th percentile threshold on each date is calculated from a total of 43 years × 15 days (7 days on either side of the target day). For instance, the threshold value on June 15 equals the 90th percentile of T2m from June 8 to June 22 during 1979–2021 (645 days).
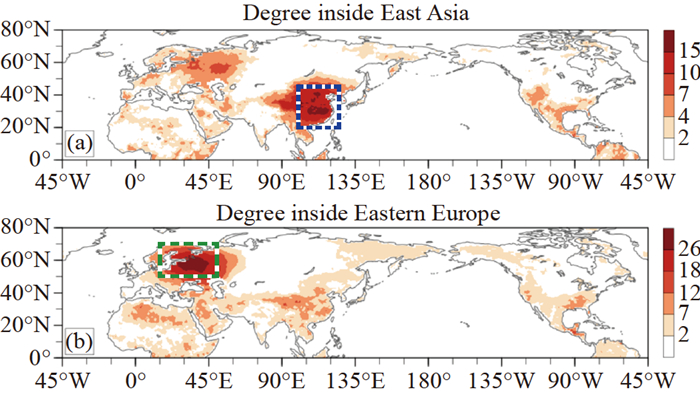
To explore the concurrences of heatwaves over different regions, we apply a network analysis in this study. The strength of a link between grid cells a and b is defined as the concurrent days, when heatwaves occur simultaneously over grid cells a and b. We shuffle the daily heatwaves (absence as 0 or presence as 1) time series 1000 times for each grid cell, and then calculate the 99th threshold of link strengths for each pair of grid cells (a, b) from the shuffled data. When the real strength of a link is lower than the 99th threshold, this link is identified as nonsignificant and will be removed. Furthermore, the degree strength is identified as the weighted sum of the link strengths, and each link is weighted by $\cos \left({({\rm{latitud}}{{\rm{e}}_a} + {\rm{latitud}}{{\rm{e}}_b}} \right)/2)$. In particular, the degree strength of a grid cell inside East Asia (${D^{{\rm{EA}}}}$) is the weighted sum of the links between this grid cell and grid cells in East Asia (Fig. 1a). Similarly, the degree strength ${D^{{\rm{EE}}}}$ is the weighted sum of link strengths inside Eastern Europe (Fig. 1b).

Figure 1. Degree strengths (units: 103) inside (a) East Asia (${D^{{\rm{EA}}}}$), and (b) Eastern Europe (${D^{{\rm{EE}}}}$). ${D^{{\rm{EA}}}}$ (${D^{{\rm{EE}}}}$) over a grid cell is the summed strengths of all significant links between this grid cell and the grid cells in East Asia (Eastern Europe). The strength of a link between grid cells a and b is identified by counting the concurrent days without delay when heatwaves occur over both grid cells a and b. The domains of East Asia (20°–45°N, 100°–125°E) and Eastern Europe (50°–70°N, 15°–50°E) are denoted by the blue box in (a) and green box in (b), respectively.
Regional heatwave days are identified when the number of heatwave grid cells in this region is higher than a certain value. In particular, about 10% (401 days) of the 3956 summer days are recognized as East Asian heatwave events when heatwaves occur in no less than 80 grid cells over 20°–45°N, 100°–125°E. The first day of each East Asian heatwave event is denoted as A0. The days after A0 are symbolized as A1 (i.e., A0 + 1 day), A2, A3, …, while the days before A0 are signified as B1 (i.e., A0 –1 day), B2, B3, …, etc. Similarly, Eastern European heatwave events are identified when heatwaves occur in no less than 130 grid cells over 50°–70°N, 15°–50°E, so that about 10% (398 days) of the summer days are selected as the Eastern European heatwave days.
To further investigate the development of East Asian surface warming and related physical processes, we conduct a composite analysis. There are three categories: A0–A1, B1–B2, and B3–B4. Category A0–A1 includes days A0 and A1, but those days A1 without the occurrences of East Asian heatwave events are excluded. Moreover, categories B1–B2 and B3–B4 include days that are two days and four days before the days in category A0–A1, respectively. Furthermore, days of June 1 to June 4 in categories A0–A1 are excluded so that days in categories B1–B2 and B3–B4 are still within the range from June to August. There are 155 days in each category. Composite anomalies are the differences between the average physical variables in each category (155 days) and the climatology (3956 days). Student's t-test is used to test whether composite anomalies are significant, which are provided by the NCL function "ttest" (
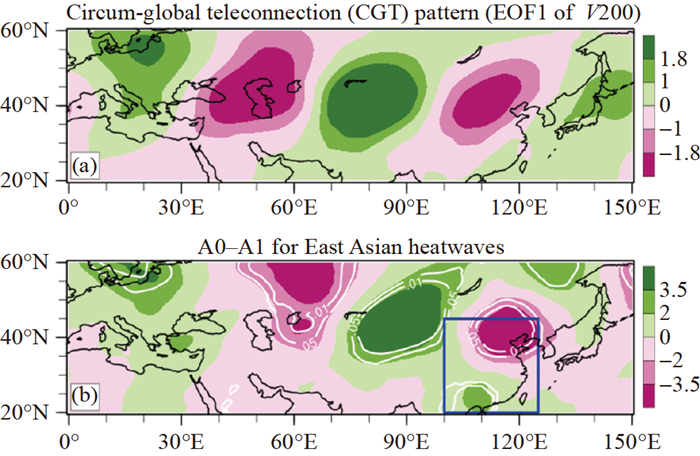
https://www.ncl.ucar.edu/Document/Functions/Built-in/ttest.shtml ).To investigate the wave packets related to Eurasian heatwaves, an empirical orthogonal function (EOF) analysis is performed for the yearly anomalies of meridional wind at 200 hPa (V200) during JJA of 1979–2021. Following previous studies (Yasui and Watanabe [44]; Cen et al. [45]), a circum-global teleconnection (CGT) pattern is identified as the first leading mode of V200 over 20°–60°N, 0°–150°E (Fig. 2a), since its major characteristic is observed near the Asian jet stream. The EOF approach is provided by the NCL function "eofunc" (
https://www.ncl.ucar.edu/Document/Functions/Built-in/eofunc.shtml ).
Figure 2. (a) Circum-global teleconnection pattern represented by the leading EOF mode of meridional wind at 200 hPa (V200) over 20°–60°N, 0°–150°E. The EOF result is calculated from the JJA mean (yearly) fields from 1979 to 2021, which are obtained from the ERA5 dataset. (b) Composite anomalies of V200 (shadings; units: m s–1) for the category A0–A1 of East Asian heatwave events from the climatology. The contours in (b) denotes the statistically significant composite differences (p = 0.05 and p = 0.01). The blue box in (b) indicates the area of East Asia (20°–45°N, 100°–125°E). The pattern correlation between (a) and (b) is 0.61, significant at the 99.9% confidence level.
Furthermore, the propagation of atmospheric Rossby waves can be described by the wave activity flux (Takaya and Nakamura [46]), which can be written as follows:
$$ W=\frac{p\cos \varphi}{2|\bar{U}|}\left[\begin{array}{c} \frac{\bar{u}}{a^2 \cos ^2 \varphi}\left(\left(\frac{\partial \psi^{\prime}}{\partial \lambda}\right)^2-\psi^{\prime} \frac{\partial^2 \psi^{\prime}}{\partial \lambda^2}\right)+\frac{\bar{v}}{a^2 \cos \varphi}\left(\frac{\partial \psi^{\prime}}{\partial \lambda} \frac{\partial \psi^{\prime}}{\partial \varphi}-\psi^{\prime} \frac{\partial^2 \psi^{\prime}}{\partial \lambda \partial \varphi}\right) \\ \frac{\bar{u}}{a^2 \cos \varphi}\left(\frac{\partial \psi^{\prime}}{\partial \lambda} \frac{\partial \psi^{\prime}}{\partial \varphi}-\psi^{\prime} \frac{\partial^2 \psi^{\prime}}{\partial \lambda \partial \varphi}\right)+\frac{\bar{v}}{a^2}\left(\left(\frac{\partial \psi^{\prime}}{\partial \varphi}\right)^2-\psi^{\prime} \frac{\partial^2 \psi^{\prime}}{\partial \lambda^2}\right) \end{array}\right] $$ where p = pressure (per 1000 hPa), while φ, λ, and a are latitude, longitude, and earth radius, respectively. Moreover, ψ' represents the anomaly of the stream function, while $\bar U$, $\bar u$, and $\bar v$ indicate the climatology of the wind speed, zonal wind, and meridional wind, respectively.
-
Figure 1 shows the degree strengths inside East Asia (${D^{{\rm{EA}}}}$) and Eastern Europe (${D^{{\rm{EE}}}}$). High degree strengths indicate high simultaneous occurrences of heatwave days with East Asian heatwaves or Eastern European heatwaves. In addition to local synchronisation, East Asian heatwaves usually occur simultaneously with the heat extremes over Eastern Europe, the Middle East, and Southern North America (Fig. 1a). It is noticeable that the highest degree strengths ${D^{{\rm{EA}}}}$ are over Eastern Europe. Therefore, degree strengths inside Eastern Europe heatwaves (${D^{{\rm{EE}}}}$) are investigated further. Consistently, East Asian heatwaves are found to be highly synchronized with Eastern European heatwaves (Fig. 1b). Meanwhile, the heat extremes over the Middle East, Northeast Asia, and Southern North America are also correlated to the Eastern European heatwaves (Fig. 1b), implying strong links of heatwaves among these regions. However, investigating the details of extreme event teleconnection around the globe is beyond the scope of this article. In the following, we will focus on the remarkable simultaneous occurrences of heatwaves over Eastern Europe and East Asia.
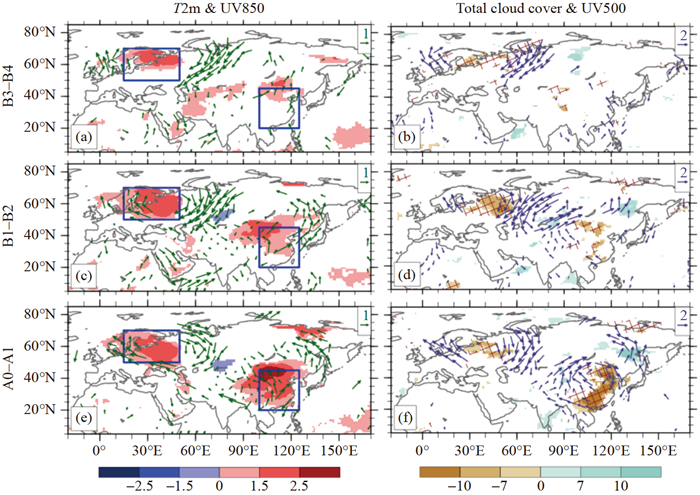
To further analyze the lead-lag details of the nearly-simultaneous remote heatwaves over Eurasia, we conduct a composite analysis for East Asian heatwave events. The differences in T2m and atmospheric circulations between the climatology and the days in the categories A0–A1, B1–B2, and B3–B4 for East Asian heatwaves are shown in Fig. 3. For East Asia, T2m experiences a rapid increase before the onset of East Asian heatwaves (Figs. 3a, 3c, and 3e). The sudden surface warming over East Asia could be attributed to the formation of anticyclonic circulation anomalies in the middle- and upper-troposphere over East Asia (Figs. 3b, 3d, and 3f; Figs. 6b, 6e, and 6h). On the one hand, the anticyclone-related subsidence causes adiabatic heating in the entire troposphere (Figs. 4d and 4f). On the other hand, the reduction of total cloud cover and the increase in downward solar radiation also favor abrupt atmospheric heating near the surface (Figs. 3b, 3d, and 3f). For Eastern Europe, similar processes are involved, including anticyclonic circulation anomalies, enhanced adiabatic heating, less cloud cover, and more downward solar radiation (Fig. 3; Figs. 4a, and 4c).

Figure 3. Composite anomalies of (a, c, e) air temperature at 2 m (shadings; units: K), and (b, d, f) total cloud cover (shadings; units: %). The anomalies of atmospheric circulation (colored vectors; units: m s–1) at 850 hPa and 500 hPa are also shown in (a, c, e) and (b, d, f), respectively. Composite anomalies are the averaged differences between the climatology and days in a certain category. (e, f) are the differences between climatology and the category A0–A1 of East Asian heatwaves, while (c, d) and (a, b) are for category B1–B2 and B3–B4, respectively. Only the statistically significant values at the 95% confidence level are plotted. The red stippling in (b, d, f) denotes significant positive deviations of downward solar radiation from climatology (p < 0.05). The blue boxes in (a, c, e) denote the areas of Eastern Europe (50°–70°N, 15°–50°E) and East Asia (20°–45°N, 100°–125°E).

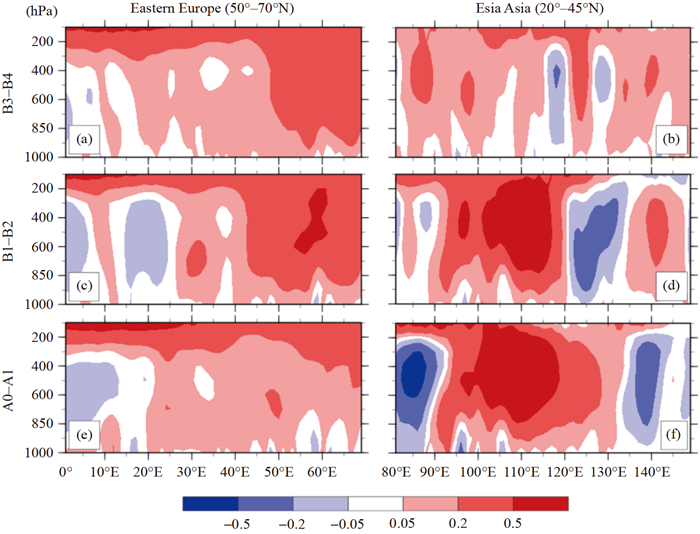
Figure 4. Composite anomalies of adiabatic heating ($ - {\left({\frac{p}{{{p_0}}}} \right)^{\frac{R}{{{C_p}}}}} \cdot \mathit{\omega } \cdot \frac{{\partial \theta }}{{\partial p}}$; units: K day–1) averaged over (a, c, e) 50°–70°N, and (b, d, f) 20°–45°N. (e, f) are the composite anomalies for the category A0–A1 of East Asian heatwaves from the climatology, while (c, d) and (a, b) are for the categories B1–B2 and B3–B4, respectively.

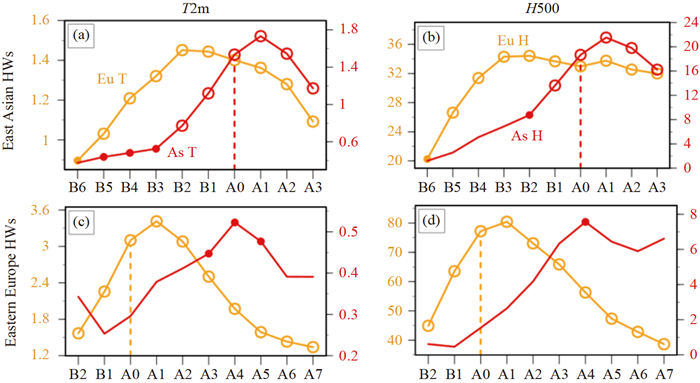
Figure 5. Composite anomalies of (a, c) atmospheric temperature at 2 m (units: K) and (b, d) geopotential height at 500 hPa (units: gpm). The composite fields are differences between the climatology and the regional heatwave days for (a, b) from 6 days before (B6) to 3 days after (A3) the East Asian heatwave events, and (c, d) from 2 days before (B2) to 7 days after (A7) the Eastern European heatwave events. Orange-yellow lines indicate the areal-averaged values over Eastern Europe (left dashed axes; 50°–70°N, 15°–50°E), while the red lines are for East Asia (right dashed axes; 20°–45°N, 100°–125°E). The composite anomalies are the differences between the averaged T2m or H500 in days A0 (or other days) and the climatology. The hollow circles (solid dots) are plotted when the differences are significant at the 99% (95%) confidence level.

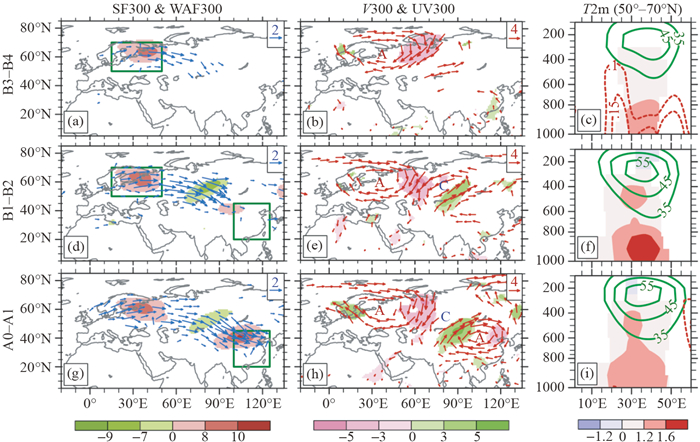
Figure 6. Composite anomalies of (a, d, g) stream function (shadings; units: 106 m2 s–1) and wave activity flux (vectors; units: m2 s–2) at 300 hPa, and (b, e, h) meridional wind (shadings; units: m s–1) and atmospheric circulation (vectors; units: m s–1) at 300 hPa. (c, f, i) are meridional averaged anomalies over 50°–70°N for atmospheric temperature (shadings; units: K), geopotential height (green solid contours; units: gpm), and atmospheric temperature tendency (red dashed contours; units: K day–1). The plotted deviations of stream functions, meridional wind, wind vectors, and atmospheric temperature are all statistically significant at the 95% confidence level. Wave activity fluxes are not shown when both directions are less than 0.5 m2 s–2 or both stream function anomalies and wind anomalies are insignificant. (g, h, i) are composite fields for the category A0–A1 of East Asian heatwaves, while (d, e, f) and (a, b, c) are for the categories B1–B2 and B3–B4, respectively. The green boxes in (a, d, g) denote the area of Eastern Europe (50°–70°N, 15°–50°E) and East Asia (20°–45°N, 100°–125°E).
It should be noted that the near-surface warming over Eastern Europe occurs about 2–4 days ahead of that over East Asia (Figs. 3a, 3c, and 3e). To exhibit the lead-lag coexistences of heatwaves over the two distant regions clearly, the composite anomalies of both T2m and geopotential height at 500 hPa (H500) are plotted in Fig. 5 for the Eastern European and East Asian heatwaves. H500 is analyzed here because surface heatwaves are often related to the middle tropospheric high-pressure center (Deng et al. [47, 48]). This way, we find that after a short period of rapid intensification, the surface warm center and middle-tropospheric high-pressure center usually reach their peaks on the second day (A1) of regional heatwave events (Fig. 5). In all four composite plots of T2m and H500, the East Asian and Eastern European peaks (i.e., highest composite anomalies) are significantly deviated from the climatology. Obviously, East Asian peaks are preceded by the Eastern European peaks, with a time lag of 3–4 days, indicating evident nearly simultaneous happenings between heat extremes over these two regions. In particular, on the sixth day (B6) before the occurrences of East Asian heatwaves, no significant East Asian T2m and H500 are observed (Figs. 5a and 5b). By contrast, significant positive anomalies of Eastern European T2m and H500 from the climatology (p < 0.01) are observed (Figs. 5a and 5b) on the B6 before East Asian heatwaves. In the following several days, sudden atmospheric warming occurred over East Asia accompanying with the occurrences of East Asian heatwaves (Fig. 5a). In summary, notable significant positive anomalies of Eastern European T2m and H500 from the climatology (p < 0.01) are observed in nearly a week ahead of the sudden atmospheric warming over East Asia (Figs. 5a and 5b), which is potentially helpful for predicting the occurrences of East Asian heatwaves.
-
Extreme weather events over distant regions could be connected by upper-tropospheric Rossby waves (Boers et al. [31]; Kornhuber et al. [39]). To clarify the physical causes associated with the lead-lag linkage between European and East Asian heatwaves on synoptic scales, we analyze the composite fields of atmospheric circulation, stream function, and wave flux activity at 300 hPa (Figs. 6a, 6b, 6d, 6e, 6g, and 6h). An eastward-propagating wave train, with alternative anticyclonic and cyclonic circulation anomalies, is observed over the Eurasian continent (Figs. 6a, 6d, and 6g). An anomalous upper-tropospheric anticyclone first appears over Eastern Europe, corresponding to the appearance of Eastern European heatwaves (Fig. 6b). Subsequently, an anomalous cyclone emerges over central Russia (Fig. 6e), accompanied with near-surface cooling (Figs. 3c and 3e). Four days later, another anomalous anticyclone appears over East Asia when heatwaves happen over the southeastern part of the Eurasian continent (Fig. 6h).
Such an eastward-propagating anticyclone-cyclone-anticyclone circulation pattern seems to be triggered by heatwave-related tropospheric warming over Eastern Europe (Fig. 6). Cen et al. [45] indicated that the tropospheric atmospheric heating over Eastern Europe could enhance an eastward propagating wave train resembling the CGT pattern. Formulated on an EOF analysis of yearly summertime V200 according to a previous study (Yasui and Watanabe [44]), the CGT pattern is identified as four alternative anomalies of upper-tropospheric northerlies and southerlies over Eurasia (Fig. 2a), which is mostly similar to the regression pattern of V200 onto another CGT index (Fig. 2a in Zhou et al. [49]; Ding and Wang [50]). Reasonably, the heatwave-related wave train in this study seems to be a part of the CGT-like pattern (Lu et al. [51]; Ding and Wang [50]; Yasui and Watanabe [44]; Wang et al. [52]), as the pattern correlation coefficient between the composite V200 anomalies for category A0–A1 of Asian heatwaves and CGT-related V200 is up to 0.61 (Figs. 2a and 2b), which is significant at the 99.9% confidence level.
In particular, the upper-tropospheric high-pressure center and anticyclonic circulation anomalies are amplified by the sudden near-surface atmospheric warming over Eastern Europe, corresponding to the appearance of Eastern European heatwaves (Figs. 6a, 6c, 6d, and 6f). In the subsequent days, wave energy propagates toward the downstream regions and another anomalous anticyclone is excited over East Asia to stimulate the incidence of East Asian heatwaves (Fig. 3e; Figs. 6g and 6h).
-
This study investigates the lead-lag occurrences of European and East Asian heatwaves on synoptic timescale. Based on network analysis and composite analysis, a significant event synchronization with a time delay of 3–4 days is uncovered between the near-surface atmospheric temperature extremes over Eastern Europe and East Asia. Although the teleconnections of heat extremes have received attention, the lead-lag details and the potential predictability on synoptic time scale have not been investigated clearly in previous studies (Deng et al. [42]; Kornhuber et al. [39]; Yang et al. [40]). About 3–4 days before the appearance of East Asian heatwaves, Eastern European heatwaves occur, accompanied by an intensified tropospheric anomalous anticyclone. A Rossby wave train, as a part of a CGT-like pattern, is triggered and propagates eastward, with alternative anomalies of high and low pressures over the Eurasian continent. Subsequently, another middle- and upper-tropospheric anomalous anticyclone in the downstream region causes sudden surface warming over East Asia as a result of both enhanced subsidence-related adiabatic heating and increased downward solar radiation due to reduced cloud cover. Thus, the eastward propagating wave train plays a vital role in linking the teleconnection of heat extremes over the Eurasian continent. Quantificationally, 43 % of East Asian heatwave events are preceded by Eastern European heatwave events in the 10-day time range before East Asian heatwave events. The investigation of heatwave teleconnection in the two remotes regions has strong potential to improve the prediction skill of East Asian heatwaves.
The standard deviations (σ) of East Asian and Eastern European daily T2m are 2.07 K and 1.57 K, respectively. It is noted that a pronounced surface warming anomaly over Eastern Europe ($\sim1.45\, {\rm{K}} = 0.7\; \sigma $, p < 0.01) is observed before the East Asian heatwaves (Fig. 5a). By contrast, the East Asian surface warming anomaly is weaker ($ \sim 0.55\, {\rm{K}} = 0.35\, \sigma $, 0.01 < p < 0.05) after the Eastern European heatwaves (Fig. 5c). The asymmetrical connection of heat extremes over the two distant regions deserves further investigations. Furthermore, a similar wave train is observed related to the springtime East Asian heatwaves (Zhang et al. [53]), emphasizing the significance of investigating the extreme event teleconnection in the transitional season. Moreover, East Asian heatwaves are also influenced by tropical forcings, such as the Pacific-Japan teleconnection pattern (Xu et al. [54]) and the Indian Ocean heat source (Gao et al. [55]), which deserves more awareness, especially under the large impacts of significant changes in the atmospheric convection over the western Pacific Ocean (Chen et al. [56]; Lin et al. [57]).

 粤公网安备 4401069904700002号