State Key Laboratory of Climate System Prediction and Risk Management/Key Laboratory of Meteorological Disaster, Ministry of Education/Collaborative Innovation Center on Forecast and Evaluation of Meteorological Disasters, Nanjing University for Information Science and Technology, Nanjing 210044 China
2.
Nansen-Zhu International Research Centre, Institute of Atmospheric Physics, Chinese Academy of Sciences, Beijing 100029 China
3.
Southern Marine Science and Engineering Guangdong Laboratory (Zhuhai), Zhuhai, Guangdong 519080 China
4.
Jilin Provincial Key Laboratory of Changbai Mountain Meteorology & Climate Change, Laboratory of Research for Middle-High Latitude Circulation Systems and East Asian Monsoon, Institute of Meteorological Sciences of Jilin Province, Changchun 130062 China
Clustered heavy precipitation (CHP) events can severely impact human society, infrastructure, and natural ecosystems. Consequently, short-term climate prediction of CHP events is vital for the prevention and mitigation of associated hazards. Employing year-to-year increment (DY) and multiple linear regression approaches, this study developed a seasonal prediction model for pre-summer (i.e., May and June) CHP frequency in South China (SC) during 1981– 2022. Three robust predictor factors were identified: March sea surface temperature in Southwestern Atlantic, early-winter snow depth in East Europe, and winter soil moisture in Central Asia. Three predictors exert substantial impacts on presummer precipitation in SC via modulation of an anomalous anticyclone (cyclone) over the (subtropical) western North Pacific. In leave-one-out cross-validation test during 1981–2022, the prediction model exhibited reasonable performance in predicting the interannual and interdecadal variations and trends of CHP days. The temporal correlation coefficient (TCC) was 0.66 between the observations and predictions. In the independent hindcast for 2013–2022, the TCC was as high as 0.85. Moreover, coherent covariations were observed between the frequency and the amounts of CHP, with a TCC of 0.99 for 1981–2022. Those three predictors show good performance in forecasting CHP amounts over SC, with a TCC of 0.68 between the predictions and observations in the cross-validation test during 1981–2022 and of 0.86 in the independent hindcasts during 2013–2022. Notably, the predictors also showed good predictive skill for years with high CHP occurrence (e.g., 1998 and 2019). The predicted high-incidence areas of heavy precipitation days were highly consistent with observations, with a pattern correlation coefficient of 0.44 (0.55) for 1998 (2019). This study provides valuable insights to improve seasonal prediction of pre-summer CHP frequency in SC.
South China (SC) is regulated by the subtropical monsoon climate, which is characterized by a long rainy season and abundant precipitation. The rainy season in SC persists from April to September, with pre-summer (i.e., May and June) precipitation amounts accounting for 32% of the annual total precipitation (Yuan et al. 2019). Anomalous precipitation in SC during summer, especially clustered heavy precipitation (CHP) events, can lead to urban flooding, inundated farmland, debris flows, and landslides on high terrain that can cause substantial economic losses and damage to people's livelihood and property. According to the China Meteorological News Agency, in June 2022, SC experienced extraordinarily strong widespread heavy rainfall events that resulted in direct economic losses exceeding 18 billion RMB. In June 2024, extensive heavy precipitation anomalies struck simultaneously most of SC, leading to direct economic losses exceeding 30 billion RMB. Therefore, short-term climate prediction of summer CHP days in SC has become an issue of increasing public concern.
Numerical simulations and statistical analysis have been used to investigate the rules governing the variations and variability of summer precipitation in SC (e.g., Feng and Li 2011; You and Jia 2018; Luo et al. 2020). Many studies demonstrated that tropical sea surface temperature (SST) anomalies are highly influential to summer precipitation anomalies in SC. For example, ENSO is crucial for the establishment and maintenance of the western North Pacific anticyclone (WNPAC), which further affects the summer precipitation anomaly in SC (Huang and Wu 1989; Wang et al. 2000; Chen et al. 2011;
Yao et al. 2016; Li et al. 2018). Warm SST anomalies in the eastern Indian Ocean can strengthen the WNPAC by inducing precipitation heating and facilitate pre-summer precipitation anomalies in SC (Yim et al. 2014). The zonal SST dipole pattern in the tropical Pacific exerts an impact on the intensity and location of the WNPAC via the Matsuno-Gill-type response (Wu et al. 2006; Qiang and Yang 2013; Gu et al. 2018), which affects precipitation over SC during the pre‐ flood season. Moreover, the Barents-Kara Sea ice during previous winter and the Eurasian snow cover during spring have substantial influences on geopotential height anomalies in East Asia and precipitation anomalies over SC during summer via triggering Rossby wave train structure at the mid-to-high latitudes of Eurasia (Wu et al. 2009; Yang et al. 2022;
Yang et al. 2023). The abnormally dry surface soil moisture in the south-central Tibetan Plateau is linked with enhanced local surface heating anomalies and with a westward extension of the western North Pacific subtropical high, which leads to suppressed convective activities and insufficient precipitation anomalies in SC during summer (Yuan et al. 2021).
Recently, considerable efforts have been devoted to improving the subseasonal and seasonal predictive skill of summer precipitation in China. However, current state-ofthe-art dynamical models have great difficulty in providing reliable seasonal forecasts of regional/local precipitation in SC (Guo et al. 2017). Li et al. (2023) reported that the potential predictability and the practical forecasting skill of nine international models (including the ECMWF_SEAS5, JMA/MRI-CPS2, and GCFS2.0 models) are low in relation to pre-summer precipitation in SC. Furthermore, global climate models have limited ability to predict extreme precipitation in China (Zhu et al. 2020; Qin et al. 2021). Therefore, some physical-empirical statistical prediction models have been developed for seasonal prediction of summer (extreme) precipitation in China (e.g., Han et al. 2020; Huang et al. 2022).
The year-to-year increment (DY) method has been used widely for short-term climate prediction of China's climate. This approach takes advantage of the QuasiBiennial Oscillation of climate variables, and resourcefully utilizes the previous year's observational information (Wang et al. 2020), which could capture the interannual and interdecadal variations and long-term linear trends in the predictand (Yin and Wang 2016; Han et al. 2019; Xu et al. 2023). The DY approach has been applied to improve the prediction skills of the number of landfalling tropical cyclones in China during summer (Tian and Fan 2019), the average summer precipitation in China (Fan et al. 2009;
Dai and Fan 2021), and extreme precipitation days in Northeast China (Han et al. 2019), the Yangtze River Basin (Tian et al. 2013), and Southwest China (Nie et al. 2023). Therefore, it is considered feasible and reasonable to use the DY method to predict pre-summer CHP days in SC.
The remainder of this paper is organized as follows. Section 2 introduces the data and methods used in this study. Section 3 describes the interannual variation in the CHP days in SC and the associated atmospheric circulations. Sections 4 and 5 illustrate the development and the performance of the physical-empirical prediction model for pre-summer CHP in SC, respectively. Finally, Section 6 summarizes the conclusions of the study and provides further discussion.
2.
DATA AND METHODS
The following datasets were used in this study. (1) Daily precipitation data from the CN05.1 dataset with 0.25°×0.25° resolution (Wu and Gao 2013). (2) Monthly global atmospheric data from the Fifth‐ Generation European Centre for Medium‐ Range Weather Forecasts Reanalysis on a 1°×1° longitude-latitude grid (Hersbach et al. 2020), including geopotential height, horizontal wind, specific humidity, vertical velocity, soil moisture (0–7 cm), and snow depth. (3) Monthly SST data from the National Oceanic and Atmospheric Administration Extended Reconstructed SST Version 5 on a 2°×2° grid (Huang et al. 2017). All data covered the period 1980–2022.
Here, SC was defined as the region (22°–29°N, 106°– 120°E) within China. A CHP day was determined as one day when more than 30% of the grid points in SC concurrently had daily precipitation exceeding 25 mm (Li et al. 2016). The SC-CHP was defined as the frequency of pre-summer CHP events in SC. The DY of variables was defined as the difference between values in the current year and values in the preceding year, e.g., CHPDY(t) = CHP(t)-CHP(t-1). The final predictand was obtained by combining the predicted DY with the observation of the previous year. All data were calculated in the form of DY before analysis. Winter is defined as months of December, January, and February. Late winter and early spring refer to February– April and March–April, respectively. Pre-summer months are May and June.
The "leave-one-out" cross‐ validation and the "independent hindcast" approaches were used to assess the model's prediction capabilities (Michaelsen 1987). Certain indicators were used to evaluate prediction performance, including the root mean squared error (RMSE), percentage of the same sign (PSS), temporal correlation coefficient (TCC), Willmott's Index of Agreement (WI) (Willmott 2013), pattern anomaly correlation coefficient (ACC), and Nash–Sutcliffe efficiency coefficient (NSE) (Nash and Sutcliffe 1970). The value range of the NSE (WI) is from negative infinity to 1 (0–1). A value of the NSE (WI) close to 1 indicates that the model has strong predictive ability. The Student's t-test was applied to test the statistical significance of the TCC.
Horizontal wave activity flux was determined to examine the propagation of Rossby waves based on equations presented by Plumb (1985):
where WAF is the wave activity flux, p is pressure,
p0 = 1000 hPa, u and v represent the zonal and meridional wind, respectively, ϕ is geopotential height, Ω and a represent Earth's rotation rate and radius, respectively, and φ and λ indicate latitude and longitude, respectively. The superscript "'" represents latitudinal deviation.
3.
CHARACTERISTICS OF CHP EVENTS IN SC AND ASSOCIATED ATMOSPHERIC CIRCULATIONS
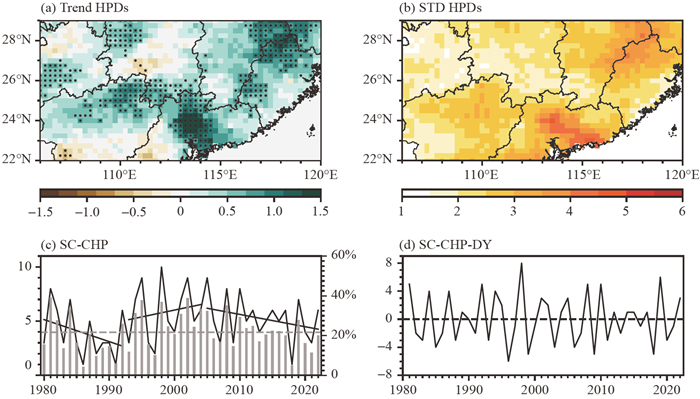
Pre-summer heavy precipitation days (HPDs) generally show a significantly upward trend in SC over the past four decades, especially in eastern and southern parts, together with large interannual variability (Figs. 1a and 1b). The SC-CHP exhibits interannual and interdecadal variations characterized as an obvious downward trend from the 1980s to the early 1990s and an upward trend from the early 1990s to the mid-2000s. After the mid-2000s, the SC-CHP showed a weak downward trend (Fig. 1c). The CHP amounts contributed an average of 22% to the total precipitation during presummer. During specific years, including 1981, 1995, 1998, and 2002, the CHP amounts contributed approximately 40% to the total precipitation during presummer in SC (Fig. 1c). Additionally, the SC-CHP displays a distinct Quasi‐ Biennial Oscillation period (figure omitted). Quantitatively, the SC-CHP-DY value was large during 1981–2010, following which it turned to be small values before increasing again during 2018–2022, implying that it might be better predicted except for the mid-2010s (Fig. 1d).
Figure
1.
Spatial distribution of the (a) trends (units: days (10a)–1) and (b) interannual variability of heavy precipitation days (shorted as HPDs) in pre-summer in South China (SC). (c) Time series of clustered heavy precipitation days at SC (shorted as SC-CHP, black line) and the percentage of SC-CHP amounts in the pre-summer total precipitation amounts (gray bars) during 1980–2022 (SC: 22°–29°N, 106°–120°E within China). Black solid straight lines represent linear trends. (d) Time series of the year-to-year increment (DY) of presummer SC-CHP events (shorted as SC-CHP-DY) during 1981–2022. Black dashed straight lines represent zero values. Dotted regions in (a) indicate statistical significance at the 90% confidence level, estimated using Student's t-test.
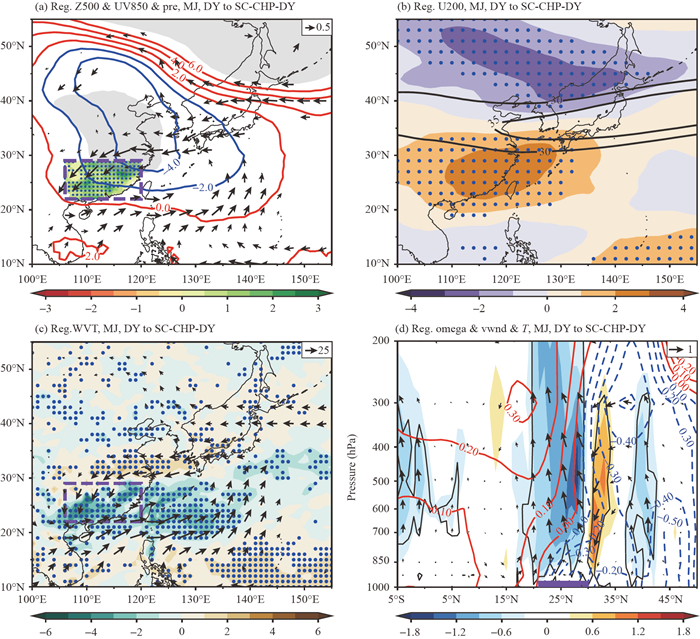
Figure 2 depicts the atmospheric circulation anomalies associated with the SC-CHP-DY. The increased SC-CHP is characterized by profound negative geopotential height anomalies over East Asia in the middle troposphere and a cyclonic anomaly centered over the East China Sea in the lower troposphere (Fig. 2a). SC is located to the west of the anomalous cyclone, along with an obvious shear line. The anomalous northeasterlies on the western flank of that anomalous cyclone transport moisture to SC across the northern boundary (Fig. 2c). The anomalous southwesterlies on the southern flank convey water vapor originating from the tropical oceans northward to SC across the southern boundary (Fig. 2c). Therefore, anomalous convergence of water vapor flux dominates SC, providing sufficient moisture for heavy precipitation. The high-incidence areas of the SC-CHP correspond to prominent moisture convergence anomalies in SC (Figs. 2a and 2c).
Figure
2.
Linear regressions of pre-summer atmospheric circulations on SC-CHP-DY index during 1981–2022. (a) 500-hPa geopotential height (contours; units: gpm; red solid lines indicate positive values and blue dashed lines indicate negative values), 850-hPa wind (vectors; units: m s−1), and precipitation (shading; units: mm d−1). (b) 200-hPa zonal wind. (c) Integrated water vapor flux (vectors; units: 102 kg m−1 s−1) and its divergence (shading; unit: 10−5 kg m−2 s−1). (d) Latitude-pressure cross section of meridional circulation (vectors; 106°–120°E average meridional wind, unit: m s−1; 106°–120°E average omega, units: 10−2 Pa s−1), temperature (contours, units: ℃), and vertical motion (shading; units: 10−2 Pa s−1). Purple rectangles (line) indicate the SC region (latitude range). Black contours in (b) show zonal wind >30 m s−1. Hatched areas in (a), vectors in (a) and (c), dotted regions in (a–c), and the area surrounded by black lines in (d) indicate statistical significance at the 90% confidence level, estimated using Student's t-test.
The intensity and position of the upper-level East Asian westerly jet play an important role in heavy precipitation events in East China (Xuan et al. 2013;
Tang et al. 2021; Zhong et al. 2023). The increased SC-CHP-DY is accompanied by a southward shift of the East Asian westerly jet and cyclonic shear over SC in the lower layer (Fig. 2b), which facilitate anomalous ascent and favor positive precipitation anomalies in SC (Figs. 2a and 2d). Moreover, the maximum vertical velocity is concurrent with the intersection of cold and warm air (Fig. 2d).
4.
PREDICTORS AND ASSOCIATED MECHANISMS
We selected potential predictors that were significantly correlated with SC-CHP-DY by utilization of year-to-year increment and linear correlation approaches. Moreover, predictors which have a stable significant relationship with SC-CHP-DY were screened through the 13-year sliding correlations. We also investigated the relationship between predictors after removing the influence of SC-CHP-DY. Finally, three predictors were identified, including March SST in Southwestern Atlantic, early-winter snow depth in East Europe, and winter soil moisture in Central Asia.
4.1
SST over Southwestern Atlantic
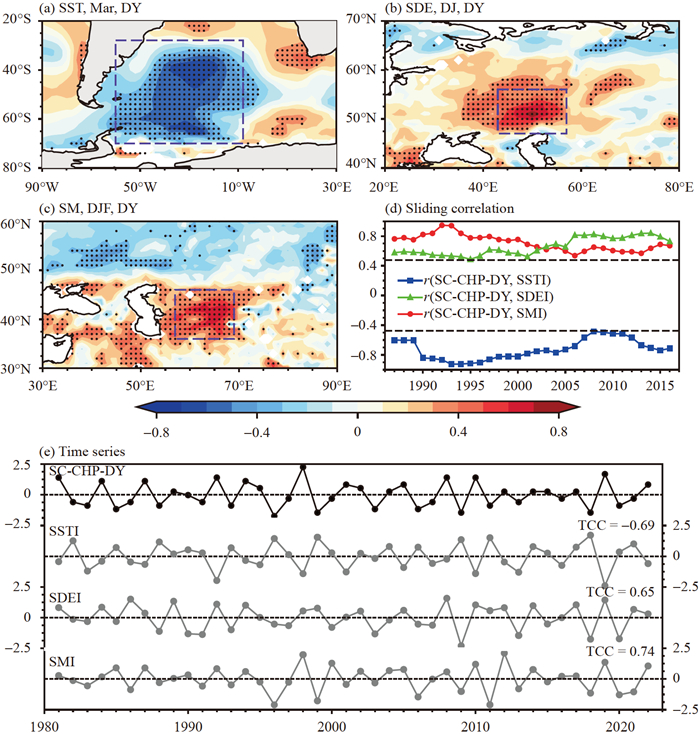
The preceding March SST-DY over Southwestern Atlantic is negatively correlated with the SC-CHP-DY. The SST index (hereafter, SSTI) is defined as the normalized area-average SST-DY during March over Southwestern Atlantic (28°–70°S, 60°–8°W; the purple box shown in Fig. 3a). The correlation coefficient between the SSTI and the SC-CHP-DY is −0.69 during 1981−2022 (significant at the 99% confidence level). It is notable that such negative correlation coefficients are statistically significant and stable during the entire period (Figs. 3d and 3e).
Figure
3.
Correlation coefficient map between the SC-CHP-DY and (a) March SST, (b) December–January SDE (SDE: snow depth), and (c) December–January–February SM (SM: soil moisture) during 1981–2022. Dotted regions in (a−c) indicate statistical significance at the 90% confidence level, estimated using Student's t-test. Purple rectangles indicate predictor regions. (d) 13-year sliding correlation between the SC-CHP-DY and SSTI, SDEI, SMI. (e) Temporal variations of the normalized SC-CHP-DY and predictors (SSTI, SDEI, and SMI) during 1981−2022. The TCCs indicate the correlation coefficients between the SC-CHP-DY and predictors. Black dashed lines in (d) show statistical significance at the 90% confidence level, estimated using Student's t-test.
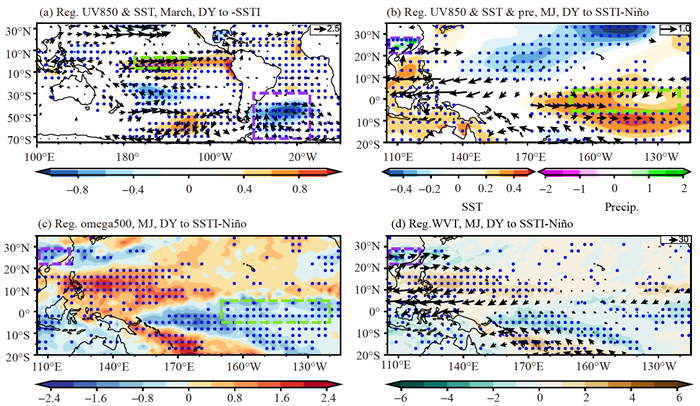
The negative SST anomalies in Southwestern Atlantic are concurrent with weakened trade wind anomalies in the equatorial Pacific and warming SST anomalies in the equatorial Central–East Pacific (Fig. 4a), which could be maintained until pre-summer (Fig. 4b). The SST-Niño index is defined as the normalized area-averaged SST DY over the Niño 3.4 region (5°N–5°S, 170°–120°W; green box shown in Fig. 4a) in March. The correlation coefficient between the SSTI and the SSTI-Niño is −0.64 during 1981–2022 (significant at the 99% confidence level). It is speculated that the equatorial Central–East Pacific SST acts as a bridge in the linkage between the Southwestern Atlantic SST and the SC-CHP. The warm SST anomalies in the tropical Central–East Pacific, accompanied by cooling SST anomalies in the tropical western North Pacific, are associated with a strengthened WNPAC during spring and the following pre-summer (Figs. 4a and 4b) (Wang et al. 2000). The anomalously warm SST in the tropical Central–East Pacific induces abnormal ascent locally, which is accompanied by anomalous descent over the tropical western North Pacific via modulation of an anomalous anti-Walker circulation. As a compensation, abnormal ascent occurs over SC (Fig. 4c). Additionally, the anomalous southerlies on the western flank of the WNPAC carry abundant water vapor toward SC (Fig. 4d). The abundant moisture supply and abnormal upward motion promote the formation of CHP events in SC.
Figure
4.
(a) Regression map of the March 850-hPa wind and SST on negative SSTI. Regressions of variables on SSTI-Niño during presummer of 1981–2022: (b) 850-hPa wind (vectors; units: m s−1), SST (shading; units: ℃), and precipitation (shading; units: mm d−1), (c) 500-hPa vertical velocity (shading; units: 10−2 Pa s−1), and (d) integrated water vapor flux (vectors; units: 102 kg m−1 s−1) and its divergence (shading; units: 10−5 kg m−2 s−1). Dotted regions indicate statistical significance at the 90% confidence level, estimated using Student's t-test. Purple rectangular boxes represent SC and SSTI areas, respectively, and the green rectangular boxes represent the SSTI-Niño area.
Snow has been considered in short‐ term climate prediction owing to its robust seasonal persistence (Zhang et al. 2016). As depicted in Fig. 3b, statistically significant positive correlations are evident between the SC-CHP-DY and the early-winter snow depth DY in East Europe. Accordingly, a second predictor, i.e., the snow depth index (SDEI), is defined as the normalized area-average earlywinter snow depth DY over East Europe (47°–56°N, 43°–57°E; the purple box shown in Fig. 3b). The correlation coefficient between the SDEI and SC-CHP-DY is 0.65 during 1981–2022 (significant at the 99% confidence level). Notably, such a statistically significant relation is stable during the entire period (Figs. 3d and 3e).
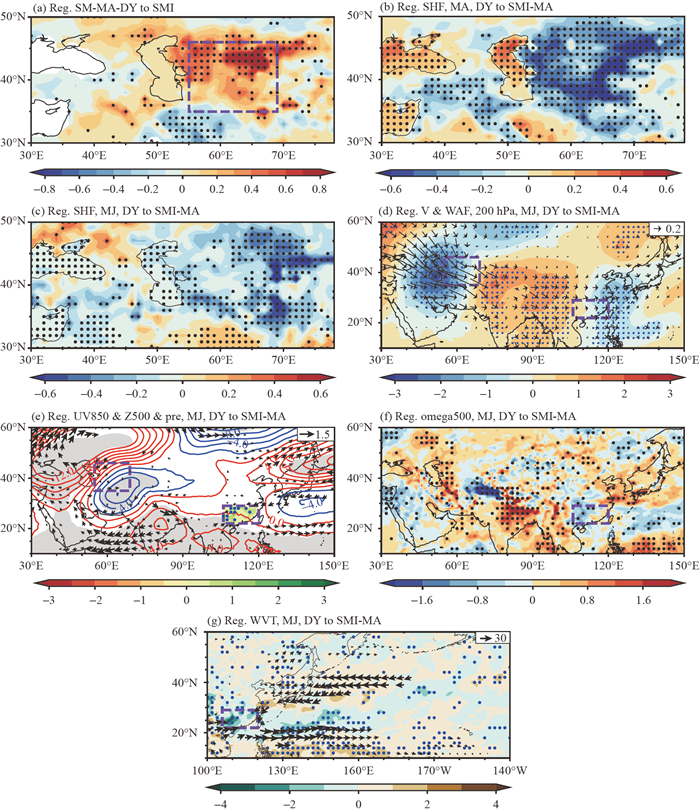
The snow depth DY anomalies over East Europe could sustain from early winter to early spring (Fig. 5a). SDEI-FMA is defined as the late-winter normalized areal average of snow depth over East Europe. The TCC between the SDEI and the SDEI-FMA indices is 0.50 during 1981–2022 (significant at the 99% confidence level). The SDEI-FMA can cause downward turbulent heat flux anomalies in late winter, as well as pre-summer (Figs. 5b and 5c), followed by eastward propagation of an anomalous Rossby wave train from East Europe to the western North Pacific over the mid-to-high latitudes of Eurasia (Fig. 5d). Concurrently, alternation of anomalous northerlies and southerlies occurs from East Europe to East China, exhibiting a wave-like pattern (Fig. 5d). Remarkable positive and negative height anomalies prevail alternately over Asia in the middle troposphere, accompanied by anomalous anticyclones over Siberia and the subtropical West Pacific and an anomalous cyclone centered over Northeast Asia in the lower layer (Fig. 5e). The negative geopotential height anomalies over East Asia are conducive to southward movement of cold air, which favors convergence of cold and warm air over SC. Simultaneously, abnormal ascent occurs over SC (Fig. 5f). The anomalous northeasterlies across the northern boundary and southwesterlies across the southern boundary jointly contribute to prominent convergence of water vapor over SC (Fig. 5g), which provides sufficient moisture for the occurrence of SC-CHP events (Fig. 5e).
Figure
5.
(a) Regression map of the February–April snow depth on the SDEI during 1981–2022. Regressions of variables on SDEI-FMA during 1981–2022: (b) turbulent heat flux in February–April (shading; units: 106 W m−2), (c) turbulent heat flux in May–June (shading; units: 106 W m−2), (d) 200-hPa meridional wind (shading; units: m s−1), and wave activity flux (vectors; units: m2 s−2) in May–June, (e) 850-hPa wind (vectors; units: m s−1), 500-hPa geopotential height (shading; units: gpm), and precipitation (shading; units: mm d−1) in May–June, (f) 500-hPa vertical velocity (shading; units: 10−2 Pa s−1) in May–June, and (g) integrated water vapor flux (vectors; units: 102 kg m−1 s−1) and its divergence (shading; units: 10−5 kg m−2 s−1). Dotted regions and hatched areas in (e) indicate statistical significance at the 90% confidence level, estimated using Student's t-test. Purple rectangular boxes represent SC and SDEI areas, respectively.
Soil moisture is an important factor for seasonal prediction of precipitation in East China (Guo et al. 2007;
Liu et al. 2016; Dong et al. 2022). The SC-CHP-DY has significant positive correlation with soil moisture DY anomalies in Central Asia (Fig. 3c). For further analysis, a soil moisture index (SMI) is defined as the normalized average of the winter soil moisture DY over Central Asia (36°−46°N, 57°−69°E; the purple box shown in Fig. 3c). The 13-year-sliding correlation coefficients suggest that the positive correlation between the SMI and SC-CHP-DY is steady during 1981–2022 (Figs. 3d and 3e), with a correlation coefficient of 0.74 (statistical significance at the 99% confidence level).
The soil moisture DY anomalies could maintain from winter to early spring (Fig. 6a). The SMI-MA is defined as the early-spring normalized area-averaged soil moisture over Central Asia. The correlation coefficient between the SMI and the SMI-MA indices is 0.37 during 1981–2022 (statistical significance at the 95% confidence level). The SMI-MA over Central Asia is associated with abnormal downward sensible heat flux DY in early spring and in the subsequent presummer in surrounding areas (Figs. 6b and 6c). Accordingly, an anomalous Rossby wave train propagates zonally from Central Asia to the western North Pacific over the midlatitudes of Asia (Fig. 6d). This wave train can also be recognized in the SMI-MA-related meridional wind anomalies (Fig. 6d). The alternating northerly–southerly–northerly– southerly anomalies extend from Central Asia to Northeast Asia. Concurrently, the geopotential height anomalies exhibit two zonal wave-like structures across Asia, with positive (negative) height anomalies over West Siberia (Central Asia), negative (positive) anomalies over Central Siberia (South Asia), and positive (negative) anomalies over the Russian Far East (the western North Pacific) (Fig. 6e). Moreover, an anomalous cyclone is centered over the western North Pacific with an anticyclone to its north, displaying a meridional dipole pattern (Fig. 6e). Correspondingly, anomalous ascent occurs over SC and anomalous descent dominates North China (Fig. 6f). Furthermore, anomalous moisture convergence occurs over the region stretching from SC to the tropical western North Pacific. These conditions jointly facilitate precipitation anomalies over SC (Fig. 6g).
Figure
6.
(a) Regression map of the March–April soil moisture on SMI during 1981–2022. (b–g) Same as Figs. 5b–5g, respectively, but for regressions of variables on SMI-MA during 1981–2022.
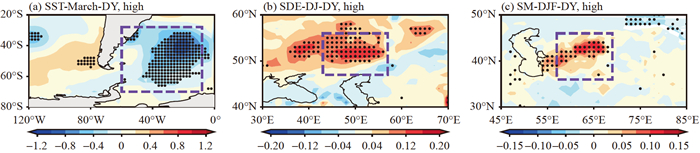
Extreme high SC-CHP-DY years are defined as the years with the standardized SC-CHP-DY index greater than 1.0. We investigated the signals of the above three predictors during extreme high SC-CHP-DY years. As depicted in Fig. 7, extreme high SC-CHP-DY is preceded by cooling SST anomalies in Southwestern Atlantic, increased snow depth anomalies over East Europe, and wet soil moisture anomalies in Central Asia. It suggests that the three predictors might have good prediction skill in extreme SC-CHP-DY years. Notably, the correlation coefficients between the predictors after removing the influence of SC-CHP are insignificant (Table 1), indicating that the predictors are independent of each other. The above results imply that these predictors are feasible for the physical-empirical prediction model of pre-summer SC-CHP.
Figure
7.
Spatial distributions of (a) the SST anomalies (shading; units: ℃) in Southwestern Atlantic in preceding March, (b) the SDE anomalies (shading; units: m) over East Europe in preceding early winter, and (c) soil moisture anomalies (shading; units: m3 m−3) in Central Asia in the preceding winter during extreme high SC-CHP-DY years. Dotted regions indicate statistical significance at the 90% confidence level, estimated using Student's t-test.
Based on the combination of the DY and linear correlation approaches, three predictors for SC-CHP were selected: the SSTI, SDEI, and SMI. The following seasonal prediction model for SC-CHP was developed:
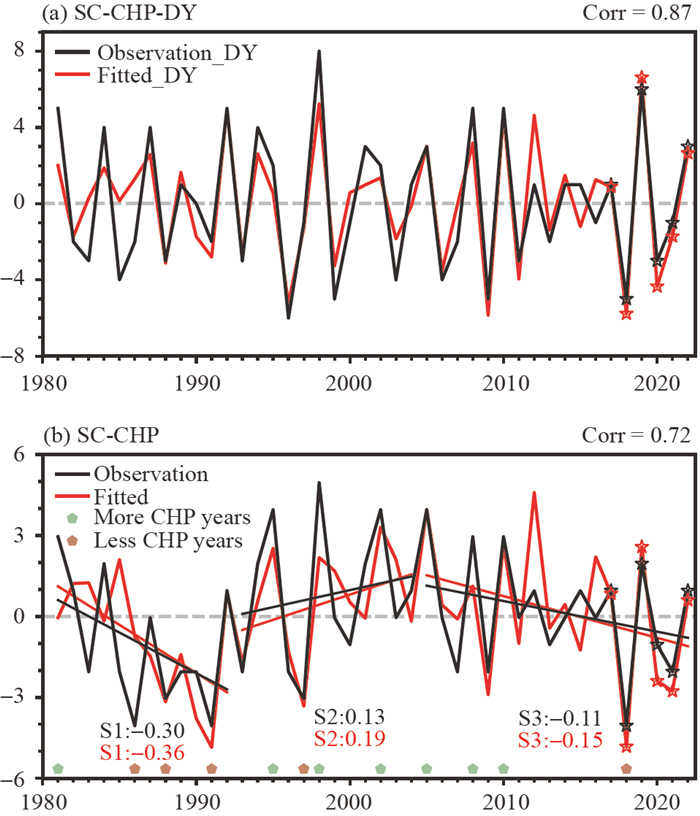
The prediction model accounts for 76.2% of the SC-CHP-DY variance. The observed and fitted SC-CHP-DY show high covariation during 1981–2022 (Fig. 8a), with a TCC of 0.87 and a PSS of 81%. The simulations are almost the same as the observations during 2017–2022. The RMSE, NSE, and WI values between the observed and fitted SC-CHP-DY are 1.71, 0.69, and 0.92, respectively. The simulated SC-CHP is obtained by adding the fitted SC-CHP-DY to the observed SC-CHP of the previous year. The prediction model can reproduce the interannual and interdecadal variations in observed SC-CHP (Fig. 8b), with a strong correlation coefficient of 0.72 between the predictions and observations (statistical significance at the 99% confidence level). Both the fitted and the observed SC-CHP values show a decreasing trend during the 1980s, increasing trend after the mid-1990s, and decreasing trend after the mid-2000s. Therefore, the prediction model effectively simulates both the linear trends and the interannual variations of SC-CHP (Fig. 8b).
Figure
8.
Time evolutions of (a) SC-CHP-DY and (b) SC-CHP during 1981–2022: observation (black solid line) and fitted values (red solid line). Gray dashed straight lines in (a) and (b) represent zero values. Black solid lines (observation) and red solid lines (fitted result) in (b) represent linear trends. Observed and fitted values during 2017–2022 are marked with stars.
The simulation performance in extreme years is of considerable importance. Extreme CHP years are identified as years with a standardized SC-CHP value of greater than (less than) 1 (−1). A total of seven years with extreme more CHP (1981, 1995, 1998, 2002, 2005, 2008, and 2010) and five years with extreme less CHP (1986, 1988, 1991, 1997, and 2018) were identified. The results indicate that the PSS in extreme years can reach 91.7% (11/12), with a corresponding PSS of 85.7% (6/7) in extreme more CHP years and of 100% (5/5) in extreme less CHP years.
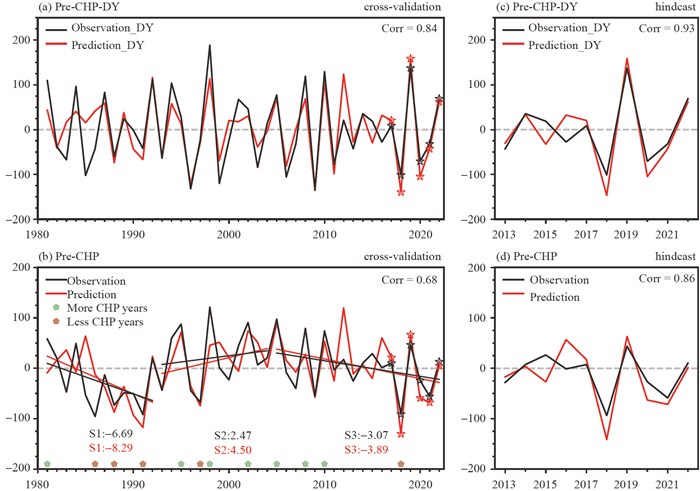
The prediction model was assessed in a leave-one-out cross-validation test over the period 1981–2022 (Figs. 9a and 9b). The TCC is 0.84 between the observed and predicted SC-CHP-DY, with PSS, RMSE, NSE, and WI values of 79%, 1.91, 0.70, and 0.91, respectively (Table 2). Additionally, the interannual and interdecadal variability of the observed SC-CHP are well captured by the simulations. The separate linear trends of the observed/predicted SC-CHP are −0.30/−0.37 during 1981–1992, 0.13/0.19 during 1993–2004, and −0.11/−0.16 during 2005–2022. The PSS, TCC, RMSE, NSE, and WI values between the observations and predictions are 69%, 0.66, 1.91, 0.33, and 0.81, respectively. The high values of the PSS, TCC, and WI indices, positive NSE, and consistent trends indicate good prediction performance in the cross-validation test.
Figure
9.
Observed (black solid lines) and predicted (red solid lines) CHP and CHP-DY in SC during the (a) and (b) cross-validation period (1981–2022) and (c) and (d) the independent hindcast period (2013–2022). Gray dashed straight lines represent zero values. Black solid lines (observation) and red solid lines (prediction) in (b) represent linear trends. Observed and fitted values during 2017– 2022 in (a) and (b) are marked with stars.
Table
2.
TCC, RMSE, NSE, WI, PSS, and extreme-CHP PSS (EPSS) between predictions and observations for the prediction model, leave-one-out cross-validation test, and independent hindcast test. One asterisk indicates that values are statistically significant at the 99% confidence level using the student's t-test.
Prediction skill was further evaluated using an independent hindcast for the recent decade (Figs. 9c and 9d). Despite the opposite signals of the SC-CHP-DY to the observations during 2015 and 2016, the predicted SC-CHP-DY is close to the observations in 2013, 2014, 2017, 2018, 2019, 2021, and 2022 (Fig. 9c). Accordingly, a high TCC (0.85) is observed between the observed and predicted SC-CHP (Fig. 9). The RMSE is relatively low (1.30), and the NSE and WI values are 0.40 and 0.89, respectively, indicating that the prediction model has good prediction performance for pre-summer SC-CHP events during the past decade in the independent hindcast.
Highly consistent variations are observed in the time evolutions of the SC-CHP days and amounts, with a correlation coefficient of 0.99 during 1981–2022 (significant at the 99% confidence level). It is speculated that the above three predictors could be utilized to predict the CHP amounts in SC (referred to as Pre-CHP). A seasonal prediction model for Pre-CHP was constructed as follows:
The cross-validation results indicate that the predicted Pre-CHP can capture the interannual and interdecadal variations in Pre-CHP (Fig. 10b), which exhibit an obvious downward trend from the 1980s to the early 1990s, an upward trend from the mid-1990s to the early 2000s, and a downward trend after the mid-2000s. The TCC, NSE, WI, and RMSE values between the observed and predicted Pre-CHP are 0.68, 0.36, 0.82, and 44.11, respectively (Fig. 10b). The prediction model was further evaluated using an independent hindcast for 2013– 2022 (Figs. 10c and 10d). The results show that the TCC, NSE, WI, and RMSE values between the observed and predicted Pre-CHP are 0.86, 0.32, 0.89, and 32.26, respectively (Fig. 10d). These results indicate that the three preceding predictive factors also exhibit excellent predictive capability for Pre-CHP (Fig. 10).
Figure
10.
As in Fig. 9 but for pre-summer CHP amounts in SC (referred to as Pre-CHP).
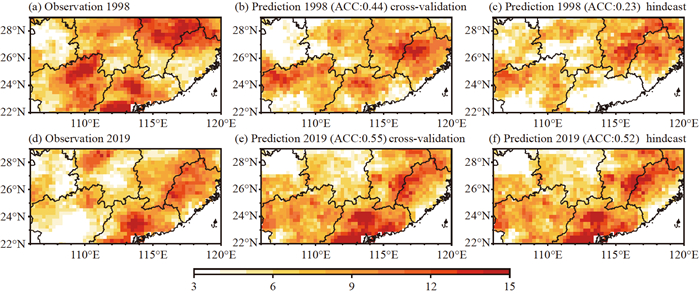
Effective prediction of high-incidence areas of heavy precipitation is of great importance for disaster prevention and mitigation. Therefore, we explored the predictive implications of those three factors for the geographical distributions of heavy precipitation events over SC in 1998 and 2019. In 1998, SC was subjected to record-breaking widespread extreme heavy precipitation events (Fig. 11a). More recently, in 2019, exceptionally frequent SC-CHP events hit SC (Fig. 11c). In 1998, Guangdong, Guangxi, Jiangxi, and Fujian in SC suffered from highly frequent HPDs. Although underestimated in magnitude, the high-incidence areas are well reproduced in the cross-validations test (Figs. 11a and 11b). The ACC between the observations and the simulation is 0.44. The independent hindcast simulates large values in Guangxi, Jiangxi, and Fujian (Fig. 11c). In 2019, frequent HPDs occurred in southeastern coastal areas of SC and in Hunan and Guangxi (Fig. 11d). The spatial features of the predicted HPDs agree well with the observations, especially in the coastal high-incidence areas, with a high ACC of 0.55 (Figs. 11e and 11f). These case studies indicate that the above three predictors have certain predictive capability in terms of the spatial distribution of HPDs in SC.
Figure
11.
(a) and (d) Spatial distributions of observed HPDs in 1998 and 2019, respectively. (b) and (e) As in (a) and (d), but for the cross-validation results. (c) and (f) As in (a) and (d), but for the independent hindcast results.
This study investigated a physical-empirical seasonal prediction model for CHP in SC using DY and linear regression approaches. Three preceding factors were selected: March SST DY in Southwestern Atlantic, early winter snow depth DY in East Europe, and winter soil moisture DY in Central Asia. Notably, the high correlation coefficients found between the three factors and the SC-CHP-DY were stable during 1981–2022.
A cool SST anomaly in Southwestern Atlantic accompanied by a warm SST anomaly in the tropical Central–East Pacific could be maintained into pre-summer. The warm SST DY anomaly in the tropical Central–East Pacific is associated with the WNPAC. The southerly wind on the western flank of the WNPAC brings abundant warm and humid air to SC. Simultaneously, anomalous descent induced by the WNPAC leads to compensatory ascent over SC, favoring the occurrence of SC-CHP events. Increased snow depth anomalies in East Europe persisting from the previous winter to early spring trigger abnormal downward turbulent heat flux anomalies in pre-summer. Both the increased snow depth in East Europe and the enhanced soil moisture in Central Asia are followed by strengthened anticyclonic circulation anomalies over East Asia and increased pre-summer precipitation in SC via propagation of an anomalous Rossby wave train stretching from East Europe to South China.
In the leave-one-out cross-validation test for the period 1981–2022, the observed and predicted TCC, PSS, and RMSE values were 0.66, 69%, and 1.91, respectively. Furthermore, the predicted SC-CHP can accurately capture the observed trend changes. The independent hindcast test for 2013–2022 demonstrated good predictive performance with TCC, PSS, and RMSE of values 0.66, 69%, and 1.91, respectively. It is noticeable that this seasonal prediction model exhibits excellent predictive skill during extreme SC-CHP years, with a high PSS value of 91.7%. Notably, the geophysical distribution of extreme frequent SC-CHP years could be reproduced, including that of 1998 and 2019. The fitted high-incidence area (such as Guangxi, Guangdong, Fujian, and Jiangxi) was in accord with the observations in the cross-validation test and the independent hindcast test.
The CHP amounts covary consistently with clustered HPDs in SC with a TCC of 0.99 for 1981–2022. The crossvalidation and the independent hindcast tests suggest that the three predictors show good prediction of CHP amounts during pre-summer in SC. The TCC between the predictions and the observations was 0.68 during 1981– 2022 in the cross-validation test and as high as 0.86 in the independent hindcast test for 2013–2022.
Fig
1.
Spatial distribution of the (a) trends (units: days (10a)–1) and (b) interannual variability of heavy precipitation days (shorted as HPDs) in pre-summer in South China (SC). (c) Time series of clustered heavy precipitation days at SC (shorted as SC-CHP, black line) and the percentage of SC-CHP amounts in the pre-summer total precipitation amounts (gray bars) during 1980–2022 (SC: 22°–29°N, 106°–120°E within China). Black solid straight lines represent linear trends. (d) Time series of the year-to-year increment (DY) of presummer SC-CHP events (shorted as SC-CHP-DY) during 1981–2022. Black dashed straight lines represent zero values. Dotted regions in (a) indicate statistical significance at the 90% confidence level, estimated using Student's t-test.
Fig
2.
Linear regressions of pre-summer atmospheric circulations on SC-CHP-DY index during 1981–2022. (a) 500-hPa geopotential height (contours; units: gpm; red solid lines indicate positive values and blue dashed lines indicate negative values), 850-hPa wind (vectors; units: m s−1), and precipitation (shading; units: mm d−1). (b) 200-hPa zonal wind. (c) Integrated water vapor flux (vectors; units: 102 kg m−1 s−1) and its divergence (shading; unit: 10−5 kg m−2 s−1). (d) Latitude-pressure cross section of meridional circulation (vectors; 106°–120°E average meridional wind, unit: m s−1; 106°–120°E average omega, units: 10−2 Pa s−1), temperature (contours, units: ℃), and vertical motion (shading; units: 10−2 Pa s−1). Purple rectangles (line) indicate the SC region (latitude range). Black contours in (b) show zonal wind >30 m s−1. Hatched areas in (a), vectors in (a) and (c), dotted regions in (a–c), and the area surrounded by black lines in (d) indicate statistical significance at the 90% confidence level, estimated using Student's t-test.
Fig
3.
Correlation coefficient map between the SC-CHP-DY and (a) March SST, (b) December–January SDE (SDE: snow depth), and (c) December–January–February SM (SM: soil moisture) during 1981–2022. Dotted regions in (a−c) indicate statistical significance at the 90% confidence level, estimated using Student's t-test. Purple rectangles indicate predictor regions. (d) 13-year sliding correlation between the SC-CHP-DY and SSTI, SDEI, SMI. (e) Temporal variations of the normalized SC-CHP-DY and predictors (SSTI, SDEI, and SMI) during 1981−2022. The TCCs indicate the correlation coefficients between the SC-CHP-DY and predictors. Black dashed lines in (d) show statistical significance at the 90% confidence level, estimated using Student's t-test.
Fig
4.
(a) Regression map of the March 850-hPa wind and SST on negative SSTI. Regressions of variables on SSTI-Niño during presummer of 1981–2022: (b) 850-hPa wind (vectors; units: m s−1), SST (shading; units: ℃), and precipitation (shading; units: mm d−1), (c) 500-hPa vertical velocity (shading; units: 10−2 Pa s−1), and (d) integrated water vapor flux (vectors; units: 102 kg m−1 s−1) and its divergence (shading; units: 10−5 kg m−2 s−1). Dotted regions indicate statistical significance at the 90% confidence level, estimated using Student's t-test. Purple rectangular boxes represent SC and SSTI areas, respectively, and the green rectangular boxes represent the SSTI-Niño area.
Fig
5.
(a) Regression map of the February–April snow depth on the SDEI during 1981–2022. Regressions of variables on SDEI-FMA during 1981–2022: (b) turbulent heat flux in February–April (shading; units: 106 W m−2), (c) turbulent heat flux in May–June (shading; units: 106 W m−2), (d) 200-hPa meridional wind (shading; units: m s−1), and wave activity flux (vectors; units: m2 s−2) in May–June, (e) 850-hPa wind (vectors; units: m s−1), 500-hPa geopotential height (shading; units: gpm), and precipitation (shading; units: mm d−1) in May–June, (f) 500-hPa vertical velocity (shading; units: 10−2 Pa s−1) in May–June, and (g) integrated water vapor flux (vectors; units: 102 kg m−1 s−1) and its divergence (shading; units: 10−5 kg m−2 s−1). Dotted regions and hatched areas in (e) indicate statistical significance at the 90% confidence level, estimated using Student's t-test. Purple rectangular boxes represent SC and SDEI areas, respectively.
Fig
6.
(a) Regression map of the March–April soil moisture on SMI during 1981–2022. (b–g) Same as Figs. 5b–5g, respectively, but for regressions of variables on SMI-MA during 1981–2022.
Fig
7.
Spatial distributions of (a) the SST anomalies (shading; units: ℃) in Southwestern Atlantic in preceding March, (b) the SDE anomalies (shading; units: m) over East Europe in preceding early winter, and (c) soil moisture anomalies (shading; units: m3 m−3) in Central Asia in the preceding winter during extreme high SC-CHP-DY years. Dotted regions indicate statistical significance at the 90% confidence level, estimated using Student's t-test.
Fig
8.
Time evolutions of (a) SC-CHP-DY and (b) SC-CHP during 1981–2022: observation (black solid line) and fitted values (red solid line). Gray dashed straight lines in (a) and (b) represent zero values. Black solid lines (observation) and red solid lines (fitted result) in (b) represent linear trends. Observed and fitted values during 2017–2022 are marked with stars.
Fig
9.
Observed (black solid lines) and predicted (red solid lines) CHP and CHP-DY in SC during the (a) and (b) cross-validation period (1981–2022) and (c) and (d) the independent hindcast period (2013–2022). Gray dashed straight lines represent zero values. Black solid lines (observation) and red solid lines (prediction) in (b) represent linear trends. Observed and fitted values during 2017– 2022 in (a) and (b) are marked with stars.
Fig
11.
(a) and (d) Spatial distributions of observed HPDs in 1998 and 2019, respectively. (b) and (e) As in (a) and (d), but for the cross-validation results. (c) and (f) As in (a) and (d), but for the independent hindcast results.
Table
2
TCC, RMSE, NSE, WI, PSS, and extreme-CHP PSS (EPSS) between predictions and observations for the prediction model, leave-one-out cross-validation test, and independent hindcast test. One asterisk indicates that values are statistically significant at the 99% confidence level using the student's t-test.
Chen, T. C., W. R. Huang, M. C. Yen, 2011: Interannual variation of the late Spring–Early summer monsoon rainfall in the northern part of the South China Sea. J. Climate, 24, 4295–4313, https://doi.org/10.1175/2011JCLI3930.1.
Dai, H. X. and K. Fan, 2021: An effective downscaling model for operational prediction of summer precipitation over China. Atmos. Res., 257, 105621, https://doi.org/10.1016/j.at-mosres.2021.105621.
Dong, X., Y. Zhou, H. S. Chen, B. T. Zhou, and S. L. Sun, 2022: Lag impacts of the anomalous July soil moisture over Southern China on the August rainfall over the Huang–Huai River Basin. Climate Dyn., 58, 1737–1754, https://doi.org/10.1007/s00382-021-05989-1.
Fan, K., M. J. Lin, Y. Z. Gao, 2009: Forecasting the summer rainfall in North China using the year-to-year increment approach. Sci. China Earth Sci., 52, 532–539, https://doi.org/10.1007/s11430-009-0040-0.
Feng, J. and J. P. Li, 2011: Influence of El Niño Modoki on spring rainfall over South China. J. Geophys. Res., 116, 1–10, https://doi.org/10.1029/2010JD015160.
Gu, W., L. Wang, Z. Z. Hu, K. M. Hu, and Y. Li, 2018: Interannual variations of the first rainy season precipitation over South China. J. Climate, 31, 623–640, https://doi.org/10.1175/JCLI-D-17-0284.1.
Guo, Q., X. W. Liu, T. W. Wu, B. Y. Cheng, R. Li, and L. X. Wei, 2017: Verification and correction of East China summer rainfall prediction based on BCC_CSM Model. Chin. J. Atmos. Sci., 41, 71– 90, https://doi.org/10.3878/j.issn.1006-9895.1602.15280.(in Chinese)
Guo, W. D., Z. G. Ma, H. J. Wang, 2007: Soil moisture—an important factor of seasonal precipitation prediction and its application. Climatic Environ. Res., 12, 20–28, https://doi.org/10.3878/j.issn.1006-9585.2007.01.03.(in Chinese)
Han, T. T., H. J. Wang, X. Hao, and S. F. Li, 2019: Seasonal prediction of midsummer extreme precipitation days over Northeast China. J. Appl. Meteor. Climatol., 58, 2033–2048, https://doi.org/10.1175/JAMC-D-18-0253.1.
Li2020
——, S. F. Li, X. Hao, and X. Y. Guo, 2020: A statistical prediction model for summer extreme precipitation days over the northern central China. Int. J. Climatol., 40, 4189–4202, https://doi.org/10.1002/joc.6451.
Hersbach, H., and Coauthors, 2020: The ERA5 global reanalysis. Quart. J. Roy. Meteor. Soc., 146, 1999–2049, https://doi.org/10.1002/qj.3803.
Huang, B., and Coauthors, 2017: Extended Reconstructed Sea Surface Temperature, Version 5 (ERSSTv5): upgrades, valida-tions, and intercomparisons. J. Climate, 30, 8179–8205, https://doi.org/10.1175/JCLI-D-16-0836.1.
Huang, R. H., and Y. F. Wu, 1989: The influence of ENSO on the summer climate change in China and its mechanism. Adv. Atmos. Sci., 6, 21–32, https://doi.org/10.1007/BF02656915.
Huang, Y. Y., H. J. Wang and P. Y. Zhang, 2022: A skillful method for precipitation prediction over eastern China. Atmos. Ocean Sci. Lett., 15, 100133, https://doi.org/10.1016/j.aosl.2021.100133.
Li, H. X., H. P. Chen, and H. J. Wang, 2016: Changes in clustered extreme precipitation events in South China and associated atmospheric circulations. Int. J. Climatol., 36, 3226–3236, https://doi.org/10.1002/joc.4549.
Li, S. N., H. P. Yan and J. J. Luo, 2023: Seasonal forecasts of precipitation during the first rainy season in South China based on NUIST-CFS1.0. Adv. Atmos. Sci., 40, 1895–1910, https://doi.org/10.1007/s00376-023-2318-0.
Li, W. J., H. C. Ren, J. Q. Zuo, and H. L. Ren, 2018: Early summer southern China rainfall variability and its oceanic drivers. Climate Dyn., 50, 4691–4705, https://doi.org/10.1007/ s00382-017-3898-0. DOI: 10.1007/s00382-017-3898-0
Liu, T. T., H. S. Chen, W. Jiang, and Z. X. Li, 2016: Summer precipitation prediction in China using soil moisture and the year-to-year increment approach. Chin. J. Atmos. Sci., 40, 591–603, https://doi.org/10.3878/j.issn.1006-9895.1507.15161.(in Chinese)
Luo, Y. L., R. D. Xia and J. C. L. Chan, 2020: Characteristics, physical mechanisms, and prediction of pre-summer rainfall over South China: Research progress during 2008 – 2019. J. Meteor. Soc. Japan, 98, 19–42, https://doi.org/10.2151/jmsj.2020-002.
Michaelsen, J., 1987: Cross-validation in statistical climate forecast models. J. Appl. Meteor., 26, 1589–1600, https://doi.org/10.1175/1520-0450(1987)026<1589:CVISCF>2.0.CO;2. DOI: 10.1175/1520-0450(1987)026<1589:CVISCF>2.0.CO;2
Nash, J. E. and J. V. Sutcliffe, 1970: River flow forecasting through conceptual models part I — a discussion of principles. J. Hydrol., 10, 282–290, https://doi.org/10.1016/0022-1694(70)90255-6.
Nie, Y. B., J. Q. Sun and J. H. Ma, 2023: Seasonal prediction of summer extreme precipitation frequencies over Southwest China based on machine learning. Atmos. Res., 294, 106947, https://doi.org/10.1016/j.atmosres.2023.106947.
Plumb, R. A., 1985: On the three-dimensional propagation of stationary waves. J. Atmos. Sci., 42, 217–229, https://doi.org/10.1175/1520-0469(1985)042<0217:OTTDPO>2.0.CO;2. DOI: 10.1175/1520-0469(1985)042<0217:OTTDPO>2.0.CO;2
Qiang, X. M. and X. Q. Yang, 2013: Relationship between the first rainy season precipitation anomaly in South China and the sea surface temperature anomaly in the Pacific. Chin. J. Geophys., 56, 2583–2593, https://doi.org/10.6038/cjg20130808.(in Chinese)
Qin, P. H., Z. H. Xie and J. Zou, 2021: Future precipitation extremes in China under climate change and their physical quantification based on a regional climate model and CMIP5 model simulations. Adv. Atmos. Sci., 38, 460−479, https://doi.org/10.1007/s00376-020-0141-4.
Tang, Y., A. N. Huang, P. L. Wu, D. Q. Huang, D. K. Xue, and Y. Wu, 2021: Drivers of summer extreme precipitation events over East China. Geophys. Res. Lett., 48, e2021GL093670, https://doi.org/10.1029/2021GL093670.
Tian, B. Q. and K. Fan, 2013: Factors favorable to frequent extreme precipitation in the upper Yangtze River Valley. Meteor. Atmos. Phys., 121, 189–197, https://doi.org/10.1007/s00703-013-0261-9.
——and——, 2019: Seasonal climate prediction models for the number of landfalling tropical cyclones in China. J. Meteor. Res., 33, 837–850, https://doi.org/10.1007/s13351-019-8187-x.
Wang, B., R. G. Wu and X. H. Fu, 2000: Pacific–East Asian teleconnection: how does ENSO affect East Asian climate? J. Climate, 13, 1517–1536, https://doi.org/10.1175/1520-0442 (2000)013<1517:PEATHD>2.0.CO;2. DOI: 10.1175/1520-0442(2000)013<1517:PEATHD>2.0.CO;2
Wang, H. J., G. Q. Zhou and Y. Zhao, 2020: An effective method for correcting the seasonal—interannual prediction of summer climate anomaly. Adv. Atmos. Sci., 17, 234–240, https://doi.org/10.1007/s00376-000-0006-9.
Wu, B. Y., K. Yang and R. H. Zhang, 2009: Eurasian snow cover variability and its association with summer rainfall in China. Adv. Atmos. Sci., 26, 31–44, https://doi.org/10.1007/s00376-009-0031-2.
Wu, J. and X. J. Gao, 2013: A gridded daily observation dataset over China region and comparison with the other datasets. Chin. J. Geophys., 56, 1102–1111, https://doi.org/10.6038/cjg20130406.(in Chinese)
Wu, Z. W., Z. H. Jiang, and J. H. He, 2006: The comparison analysis of flood and drought features among the first flood period in South China, Meiyu Period in the Yangtze River and the Huaihe River Valleys and rainy season in North China in the last 50 Years. Chin. J. Atmos. Sci., 30, 391–401, https://doi.org/10.3878/j.issn.1006-9895.2006.03.03.(in Chinese)
Xu, T. B., Z. C. Yin, X. Q. Ma, Y. Y. Huang, and H. J. Wang, 2023: Hybrid seasonal prediction of meridional temperature gradient associated with "Warm Arctic–Cold Eurasia ". Adv. Atmos. Sci., 40, 1649−1661, https://doi.org/10.1007/s00376-023-2226-3.
Xuan, S. L., Q. Y. Zhang, S. Q. Sun, and C. L. Shi, 2013: Influence of the monthly variation of the East Asia westerly jet on summer rainfall in China. Climatic Environ. Res., 18, 781–792, https://doi.org/10.3878/j.issn.1006-9585.2013.12193.(in Chinese)
Yang, H. D., J. Rao, H. H. Chen, Q. Lu, and J. J. Luo, 2023: Lagged linkage between the Kara–Barents Sea ice and early summer rainfall in Eastern China in Chinese CMIP6 Models. Remote Sens., 15, 2111, https://doi.org/10.3390/rs15082111.
——, ——, and H. S. Chen, 2022: Possible lagged impact of the Arctic Sea Ice in Barents–Kara Seas on june precipitation in Eastern China. Front. Earth Sci., 10, https://doi.org/10.3389/feart.2022.886192.
Yao, S. X., Q. Huang, and C. Zhao, 2016: Variation characteristics of rainfall in the pre-flood season of South China and its correlation with sea surface temperature of Pacific. Atmos., 7, 1–12, https://doi.org/10.3390/atmos7010005.
Yim, SY., B. Wang and W. Xing, 2014: Prediction of early summer rainfall over South China by a physical-empirical model. Climate Dyn., 43, 1883–1891, https://doi.org/10.1007/s00382-013-2014-3.
Yin, Z. C. and H. J. Wang, 2016: Seasonal prediction of winter haze days in the north central North China Plain. Atmos. Chem. Phys., 16, 14843–14852, https://doi.org/10.5194/acp-16-14843-2016.
You, Y. J. and X. J. Jia, 2018: Interannual variations and prediction of spring precipitation over china. J. Climate, 31, 655– 670, https://doi.org/10.1175/JCLI-D-17-0233.1.
Yuan, C. X., J. Q. Liu, J. J. Luo, and Z. Y. Guan, 2019: Influences of tropical Indian and Pacific oceans on the interannual variations of precipitation in the early and late rainy seasons in South China. J. Climate, 32, 3681–3694, https://doi.org/10.1175/JCLI-D-18-0588.1.
Yuan, Y., X. Lai, Y. F. Gong, and J. L. Chen, 2021: The impacts of late spring soil moisture in the Tibetan Plateau on summer precipitation in eastern China. Int. J. Climatol., 41, 862–877, https://doi.org/10.1002/joc.6692.
Zhang, R. H., R. N. Zhang and Z. Y. Zuo, 2016: An overview of wintertime snow cover characteristics over China and the impact of Eurasian snow cover on Chinese climate. J. Appl. Meteorol. Sci., 27, 513–526, https://doi.org/10.11898/1001-7313.20160501.(in Chinese)
Zhong, W. X., Y. T. Wu, S. Yang, T. J. Ma, Q. Y. Cai, and Q. Liu, 2023: Heavy southern China spring rainfall promoted by multi-year El Niño events. Geophys. Res. Lett., 50, e2022GL102346, https://doi.org/10.1029/2022GL102346.
Zhu, H. H., Z. H. Jiang, J. Li, W. Li, C. X. Sun, and L. Li, 2020: Does CMIP6 inspire more confidence in simulating climate Extremes over China? Adv. Atmos. Sci., 37, 1119−1132, https://doi.org/10.1007/s00376-020-9289-1.
ZHI Yao, HAN Ting-ting, JIANG Shun-li, et al. Seasonal Prediction of Pre-Summer Clustered Heavy Precipitation Days in South China[J]. Journal of Tropical Meteorology, 2025, 31(1): 107-119. DOI: 10.3724/j.1006-8775.2025.003
ZHI Yao, HAN Ting-ting, JIANG Shun-li, et al. Seasonal Prediction of Pre-Summer Clustered Heavy Precipitation Days in South China[J]. Journal of Tropical Meteorology, 2025, 31(1): 107-119. DOI: 10.3724/j.1006-8775.2025.003
ZHI Yao, HAN Ting-ting, JIANG Shun-li, et al. Seasonal Prediction of Pre-Summer Clustered Heavy Precipitation Days in South China[J]. Journal of Tropical Meteorology, 2025, 31(1): 107-119. DOI: 10.3724/j.1006-8775.2025.003
ZHI Yao, HAN Ting-ting, JIANG Shun-li, et al. Seasonal Prediction of Pre-Summer Clustered Heavy Precipitation Days in South China[J]. Journal of Tropical Meteorology, 2025, 31(1): 107-119. DOI: 10.3724/j.1006-8775.2025.003
Export:
Share Article
Article Metrics
Article views:2 TimesPDF downloads:3 TimesCited by: Times
Manuscript History
Manuscript received:
15 August, 2024
Manuscript revised:
16 November, 2024
Manuscript accepted:
10 December, 2024
ZHI Yao, HAN Ting-ting, JIANG Shun-li, et al. Seasonal Prediction of Pre-Summer Clustered Heavy Precipitation Days in South China[J]. Journal of Tropical Meteorology, 2025, 31(1): 107-119. DOI: 10.3724/j.1006-8775.2025.003
ZHI Yao, HAN Ting-ting, JIANG Shun-li, et al. Seasonal Prediction of Pre-Summer Clustered Heavy Precipitation Days in South China[J]. Journal of Tropical Meteorology, 2025, 31(1): 107-119. DOI: 10.3724/j.1006-8775.2025.003
Table
2.
TCC, RMSE, NSE, WI, PSS, and extreme-CHP PSS (EPSS) between predictions and observations for the prediction model, leave-one-out cross-validation test, and independent hindcast test. One asterisk indicates that values are statistically significant at the 99% confidence level using the student's t-test.


 DownLoad:


 粤公网安备 4401069904700002号
 DownLoad: